Elective waiting times rise again
Just over a year ago, the Prime Minister made a headline promise that “NHS waiting lists will fall and people will get the care they need more quickly”. This week he conceded that he had not delivered. But he could easily have been tempted to sound a more optimistic note, given that the most recent available data (at the time) showed that waiting lists had abruptly improved.
If he was tempted, he was wise to resist because in December things weren’t looking so good, according to the latest data. The number of over-104 week waits rose by 55 patient pathways to 282. Over-78 week waits rose by 1,996 to 13,164. Both should have been eliminated already, according to NHS England’s targets. The next (ill-advised) milestone is to eliminate over-65 week waits by the end of March, but numbers increased by 3,811 to 98,374.
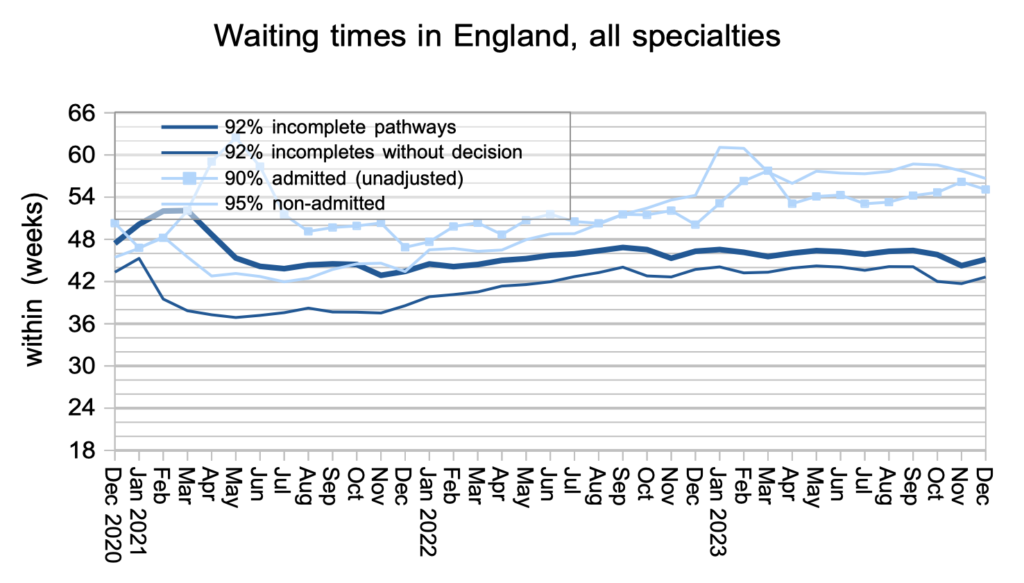
Looking at the referral-to-treatment (RTT) waiting list overall, the list size remained virtually static at 7.6 million patient pathways, and RTT waiting times increased seasonally by nearly a week to 45.2 weeks. Even if this were a good year, we would expect the waiting list to grow in the coming months, and this is not a good year.
In the following discussion, all figures come from NHS England. You can look up your trust and its prospects for achieving the current waiting time targets here.
The numbers
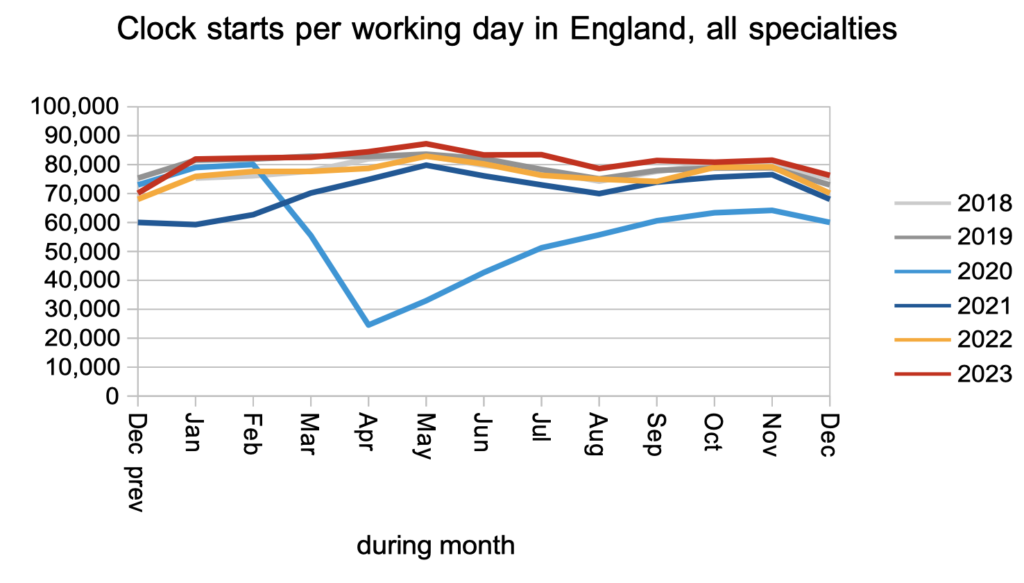
Patients were added to the RTT waiting list to start new waiting time ‘clocks’ at a slightly faster rate than pre-pandemic, following the pattern seen through 2023.
Patients were discharged from outpatients, or otherwise left the waiting list for reasons other than admission, at a significantly faster rate than pre-pandemic. Again this follows the pattern for most of 2023.

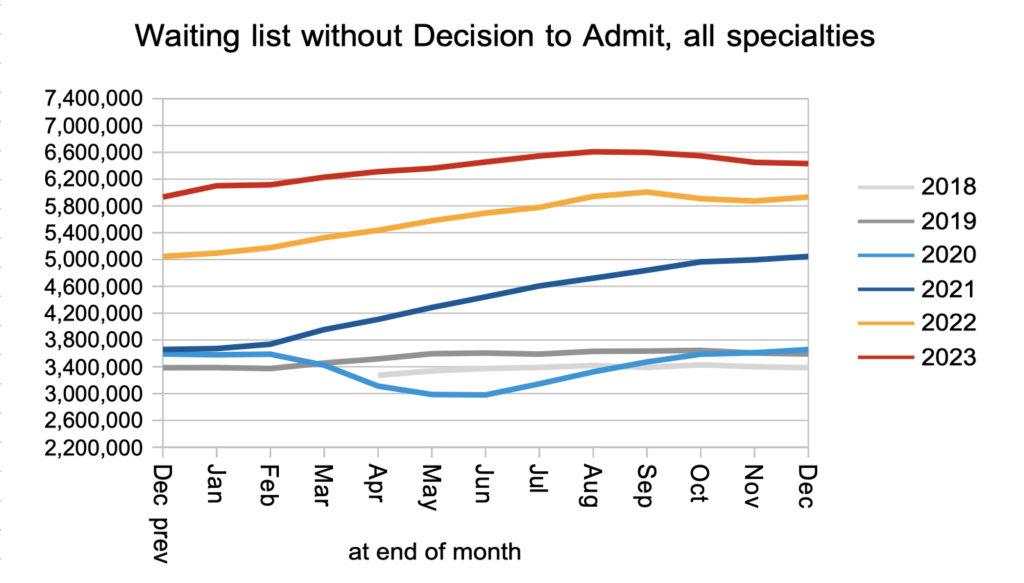
The net result of a slightly faster clock start rate, significantly faster non-admitted clock stops, together with an uncounted number of patients receiving a Decision to Admit, was that the number of patients awaiting a diagnosis and decision reduced slightly in December to 6.4 million. Within that number I estimate that 27,357 patients will eventually receive an unexpected cancer diagnosis, after a typical (and excessive) wait of 42.6 weeks.
Patients were admitted for inpatient and daycase treatment at around pre-pandemic rates, which is also typical of 2023.

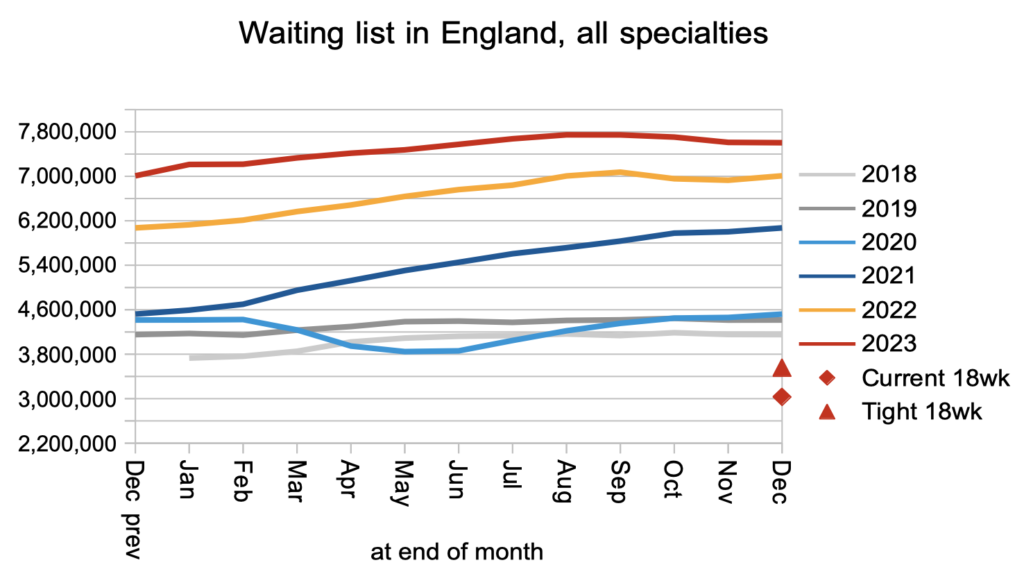
The net result of all those clock starts and stops, plus the many administrative removals from the waiting list that are not captured in the data, was that the waiting list shrank very slightly by 6,266 to 7,603,675 patient pathways. The red triangle shows that it would need to halve before the statutory 18 week target became achievable again.
What matters to patients is the length of their wait, not how many other patients are waiting alongside them. Waiting times increased in December in line with the usual seasonal pattern.
Waiting times are a function of both the size and shape of the waiting list, and the index below captures the latter. The shape of the waiting list remains slightly worse (longer-tailed) than in 2011 and significantly worse than pre-pandemic.

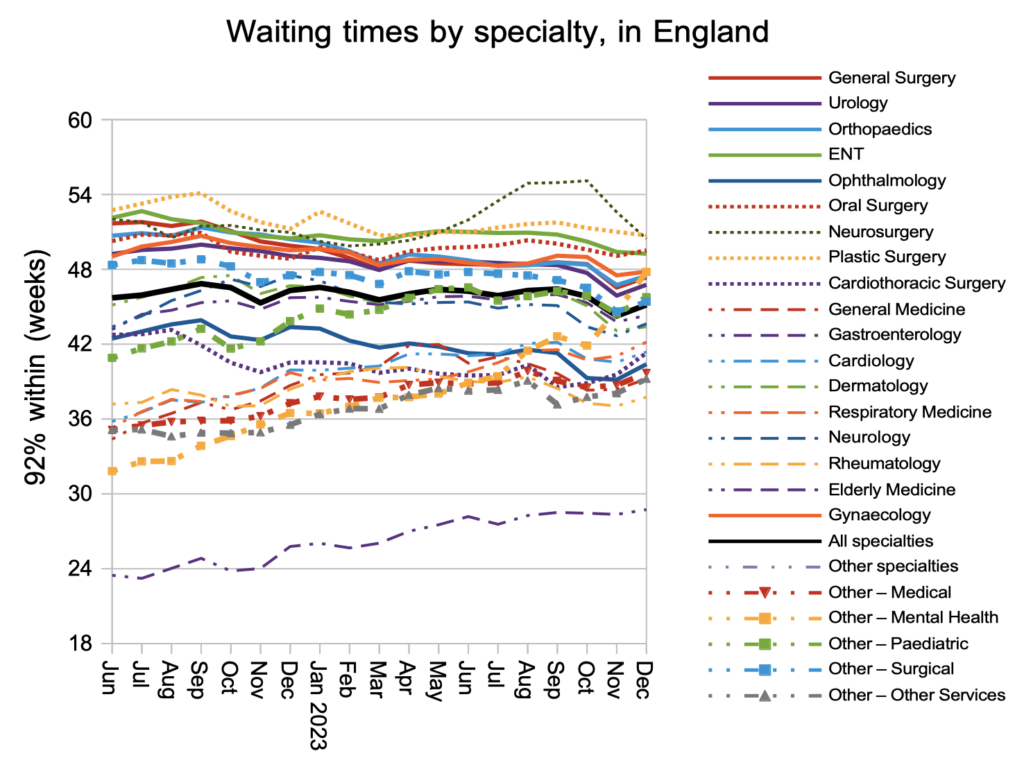
At specialty level, it is good to see that neurosurgery waiting times have fallen again nationally and are no longer an outlier. Otherwise most specialties followed the overall picture with waiting times ticking up.
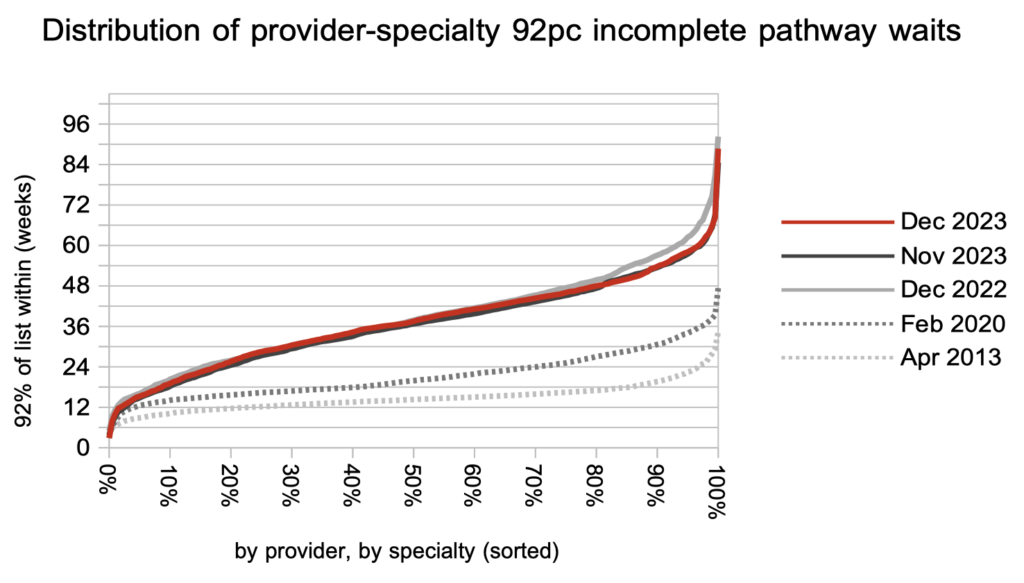
Looking at the distribution of local waiting times, by specialty and by trust, the increase in waiting times in December was seen across the board. Over the past year only the longest waiting times have reduced, in response to the targets to eliminate long waits.
Referral-to-treatment data up to the end of January 2024 is due out at 9:30am on Thursday 14th March.
