The mystery of the missing waiting list patients
03/05/2013by Rob Findlay
I have a puzzle for you: thousands of patients are apparently missing from the English waiting list. I don’t know where they are (though I’ll have a go at guessing), and I’m hoping some of you can help me.
Here’s the problem.
In principle, we should be able to start with, say, the 4-5 week waiters from the end-of-January waiting list, take away those patients who were admitted and non-admitted from the cohort during February, and (because February was exactly 4 weeks long) end up with an estimate of the 8-9 week waiters on the end-of-February waiting list.
That method would miss any patients who were removed without being seen or treated (for instance ‘validated’ patients who had been reported on the January waiting list in error), but that error should all be in one direction: to make the reported February figure smaller than our estimate. Patients cannot appear on the waiting list with several weeks on the clock out of thin air, can they? So our estimate, minus the reported end-of-February list, should always produce an anomaly that is positive and which reflects validation during February.
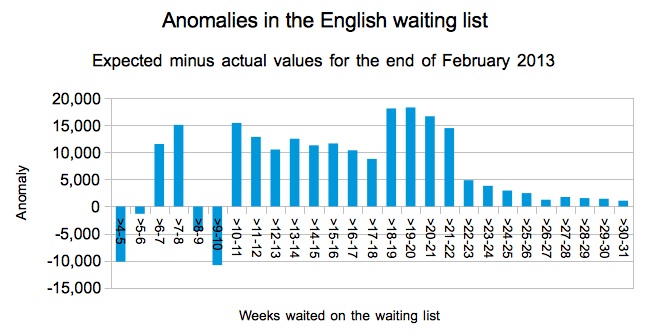
Sounds great. But if you actually do the sums you come across some oddities. Several, in fact, as you can see from the supposedly-impossible negative values in the chart below.
1) Missing very-short waiters
The first oddity is for the very shortest waiters. If you take the number of patients across England who have waited 1-2 weeks at the end of January, and knock off February’s admitted and non-admitted patients, then the expected number of 5-6 week waiters at the end of February should be no more than about 177,720. But in fact some 179,087 were reported in the end-of-February waiting list data: more than a thousand too many. That’s the small negative anomaly at 5-6 weeks in the chart above. A thousand-odd patients have appeared in the February figures out of thin air. Where did they come from?
They weren’t new referrals being treated immediately (they could only affect February’s 4-5 week cohort, which should really be part of this oddity as well). So they must only have appeared on the waiting list a week after referral. This, as far as I am aware, is quite common, because paper referrals are often graded for urgency by the consultant before being recorded on PAS, and this process can take as long as a week or two. So if that’s the explanation then that would explain the first oddity.
2) Missing 9-week waiters
The second oddity crops up at 8-10 weeks, and this is larger and more mysterious. At the end of January there were 233,003 patients on the waiting list who had waited 4-6 weeks since referral. After deducting the relevant admitted and non-admitted patients, you are left with an upper limit for 8-10 week waiters at the end of February of about 129,045. But in fact the reported figures show there were 144,434: some 15,389 too many, and causing the large negative anomaly in the chart. That’s a lot of patients suddenly appearing in the February figures. Where did they come from?
I don’t know the answer to this one, which is why I’m asking. But my guess is that this has something to do with cancer pathways. Could it be that some cancer patients are not being reported in the incomplete pathways statistics, but are being reported in the admitted and non-admitted figures? The NHS Standard Contract specifies that cancer patients should be treated within 62 days of referral, which is 9 weeks and coincides nearly enough with this anomaly. If large numbers of cancer patients are not being recorded in hospitals’ mainstream computer systems, which this explanation implies, then that in itself could be worrying because parallel and duplicate administrative systems can lead to patients getting lost.
3) Missing 17-week waiters
The third oddity is around 18 week waits. It isn’t large enough to appear as a negative anomaly in the national statistics charted above (though it does show as a step-change), but if you drill down to Trust level it does produce a negative anomaly for some individual Trusts. Because the cohort-tracking sums are inexact, and because quite a few Trusts crop up in this analysis, I am not going to name Trusts individually but instead will look at the overall pattern.
At some Trusts, the reported number of patients waiting 17-18 weeks at the end of February is higher than you would expect (a negative anomaly at Trust level), and they have no negative anomaly for 18-19 week waiters. In most cases the negative anomaly is small (or a small percentage). But in a handful of Trusts it does look significant; in other words significantly more patients are being reported just within the 18-week target than you would expect.
Again I don’t know what the explanation is, but my guess is that some Trusts (or some parts of some Trusts) might be applying clock pauses to their waiting list figures. That is strictly forbidden; the guidance says (emphasis in original):
“Clock pauses may be applied to incomplete/open pathways locally – to aid good waiting list management and to ensure patients are treated in order of clinical priority – however, adjustments must not be applied to either non-admitted or incomplete pathways RTT data reported in monthly RTT returns to the Department of Health.“
4) Disappearing 18-week breaches
The final oddity is just above the 18-week mark, and this anomaly goes in the opposite direction. From 18-22 weeks, the end-of-February waiting list is around half the expected size, so the anomaly is much more positive than expected.
My guess is that this is the result of waiting list validation being targeted at over-18-week waiters so that they don’t score against the admitted and non-admitted standards. This is a largely redundant tactic now that the main focus of the penalties, from April, is on incomplete pathways; Trusts today would be better advised to focus their validation efforts on patients approaching 18 weeks, rather than those who have already breached.
So there are four oddities in the data. If you can help explain any of them, or at least explain what is happening where you work, then do leave a comment below this post on the HSJ website (either anonymously or otherwise), or contact me in confidence by email or publicly on Twitter.
If you want to dive into the figures, you can download a spreadsheet that contains all the detailed calculations here.
POSTSCRIPT
A few more suggestions that have been put to me since I posted this:
Some missing waiters around the nine-week mark could be Choose & Book patients, who were told by C&B that no appointments were available and therefore raised an ASI (Appointment Slot Issue). Those patients might then be managed on paper by the hospital until their slot is arranged, which might take several weeks, during which they might not be reported as incomplete pathways. (Incidentally, this is a wasteful and risky administrative process, and the patient usually ends up in a similarly-dated slot to the one they would have had if C&B polling ranges had simply been extended.)
Some missing patients close to the 18-week mark at Trust level (though not at national level) are tertiary referrals. These arrive at the tertiary centre with time already on the clock (although there is now the option for the referring provider to take the ‘hit’ on any breaches caused by delays at their end: http://transparency.dh.gov.uk/files/2012/06/RTT-Reporting-patients-who-transfer-between-NHS-Trusts.pdf).
Here is a comment left at the HSJ website:
Anonymous | 2-May-2013 11:13 am
A few points come to mind in response to this article:
– As a general comment, early this (calendar) year, the impending financial penalties for >52 week waiters resulted in a flurry of activity to clear up waiting lists and address data quality issues. This almost certainly has created lots of apparent anomalies that are in fact data quality corrections.
– The >52 week penalties are contained in the standard NHS contract template – you will find that some CCGs have chosen not to include them in the final versions used for their providers. I think this may happen in situations where the provider is on a block contract. This is probably not a major factor though.
– My experience suggests that providers will not stop validating 18 week breaches against the clock stop targets – I am not sure any board or exec would simply not be worried about breaches that aren’t really breaches, financial penalty or not. It is still a core operational standard (as defined by the NTDA) so will still create a fuss if not achieved.
– as regards the missing very short waiters, grading for urgency by clinicans has definitley been known to take longer than 2 weeks. A less than one percent discrepancy could easily be explained by late grading and, probably more commonly, hospitals without single points of referral receipt not getting things on the system ina timely fashion e.g. letters going directly to med secs who sit on them for too long. If you know the patient won’t be seen for >10 weeks, why bother getting them on the system – this is the attitude in some cases at least!