Wait list reduction remains sluggish

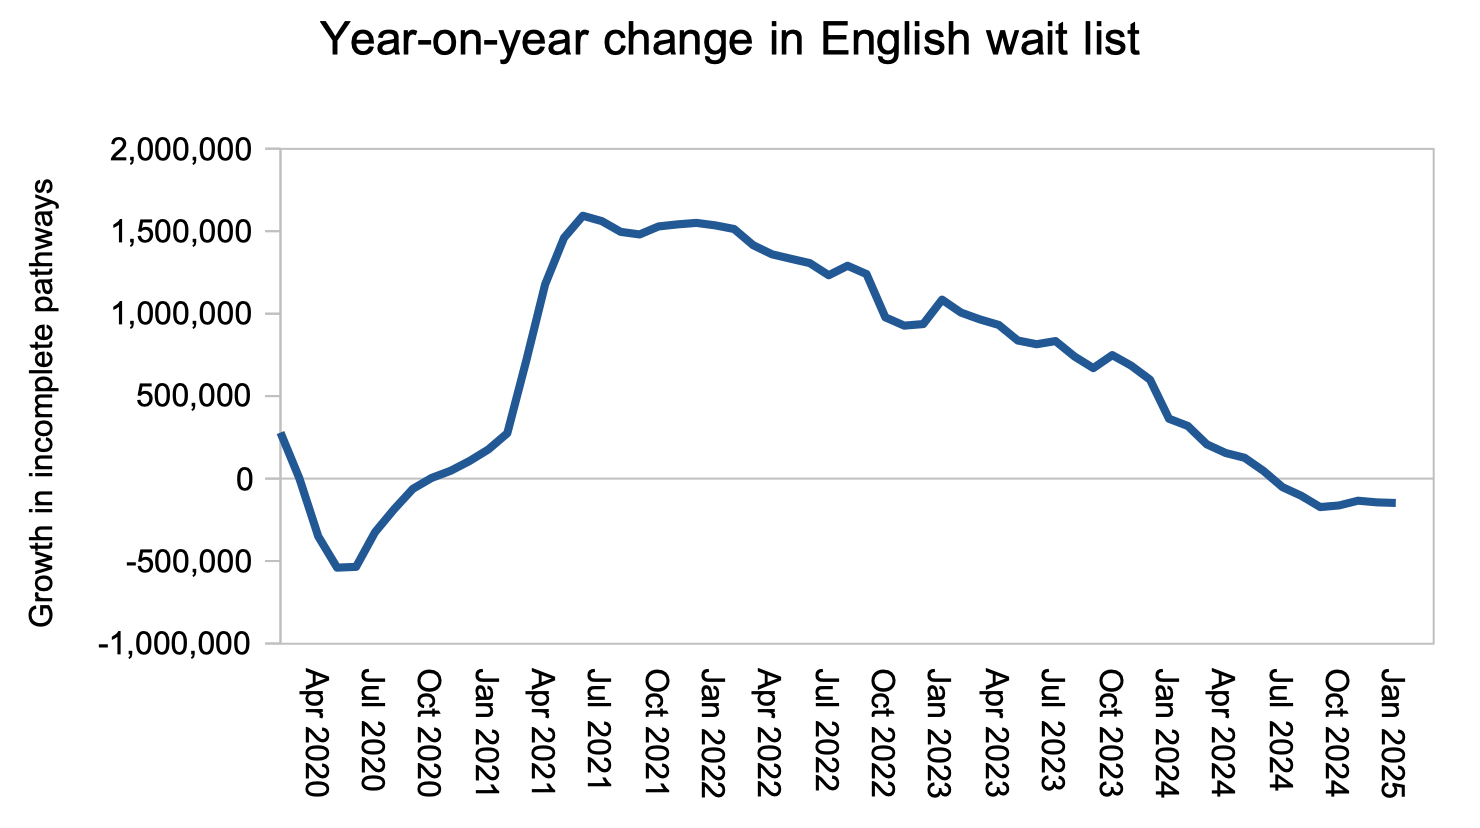
Efforts to reduce the size of the English referral-to-treatment (RTT) waiting list remained sluggish in January, with year-on-year reductions still hovering around 150,000 patient pathways. This is far short of the one million annual reduction rate that will be needed to restore the ’18 weeks’ standard by 2029 – a rate that we now know is consistent with NHS England’s estimates.
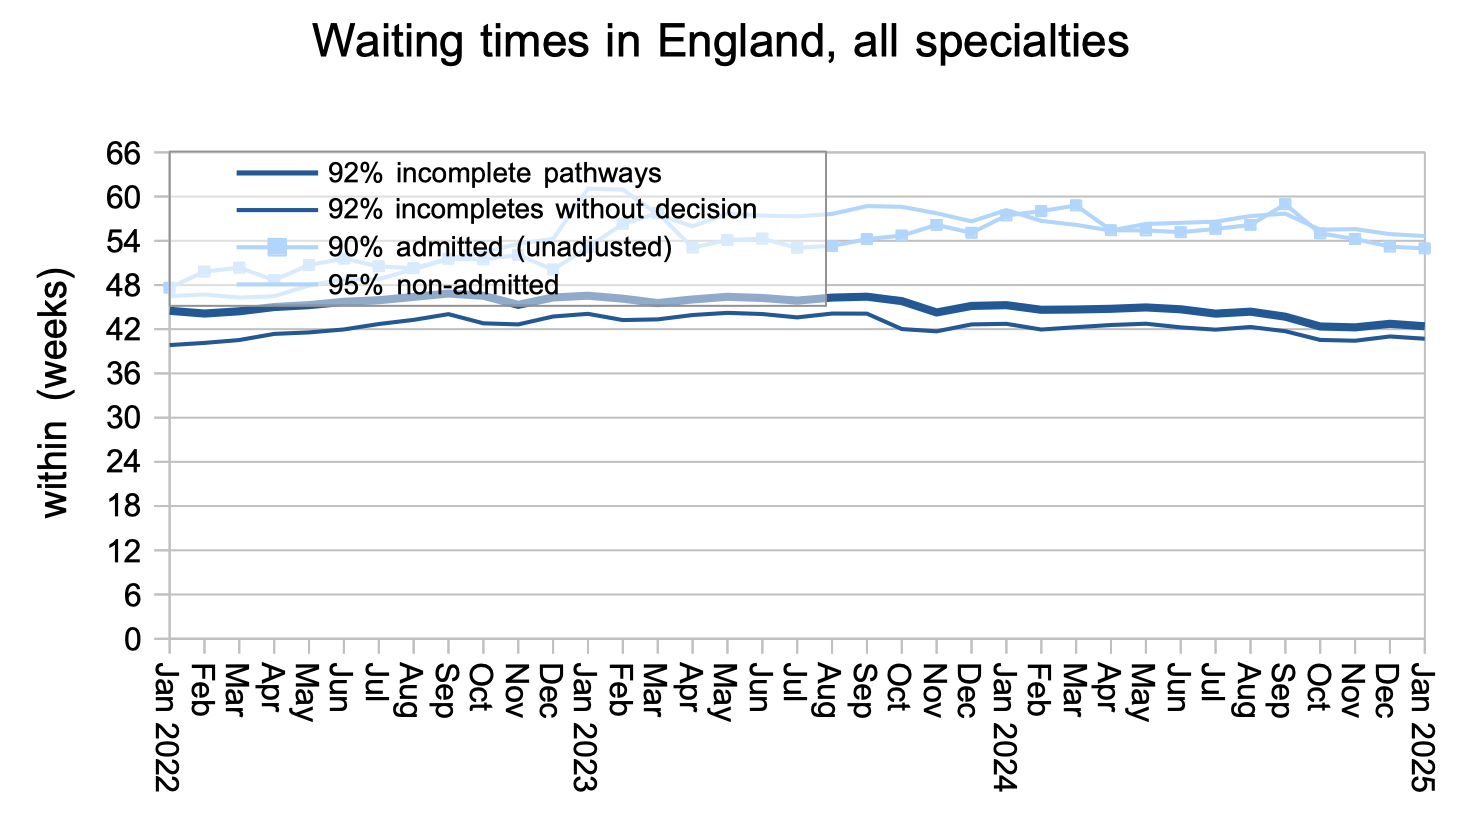
Reducing the overall size of the waiting list is not an end in itself, rather it is a means to reducing waiting times for patients. Nationally, waiting times fell slightly during January to 42.4 weeks RTT, bringing them back to where they were in October.
In the following discussion, all figures come from NHS England. You can look up your trust and its prospects for achieving the waiting time targets here.
The numbers
After consistently improving for three years, the rate of waiting list reduction has stalled at around 150,000 patient pathways per year. It needs to reach one million per year, as the chart after this will show.
At the end of January the English RTT waiting list comprised 7,428,309 incomplete patient pathways. I estimate this needs to reduce to between 3.6 million (with a good waiting list shape) and 3.2 million (at the current waiting list shape) to restore the 18 weeks standard; those estimates are likely to increase over the years as demand increases. It follows from those estimates that the waiting list needs to fall by about 4 million over four years, which is where the one million per year reduction figure comes from.
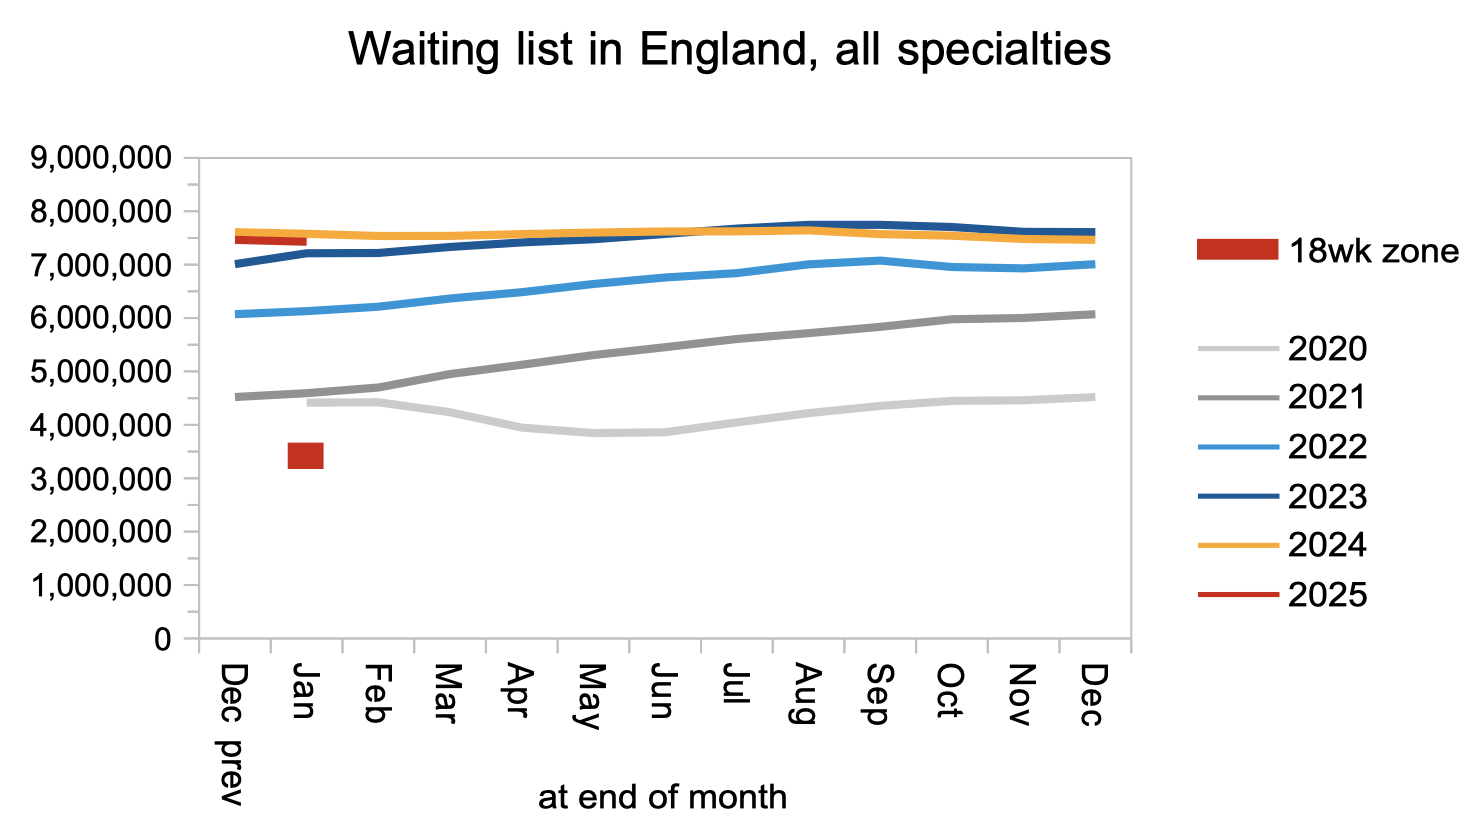
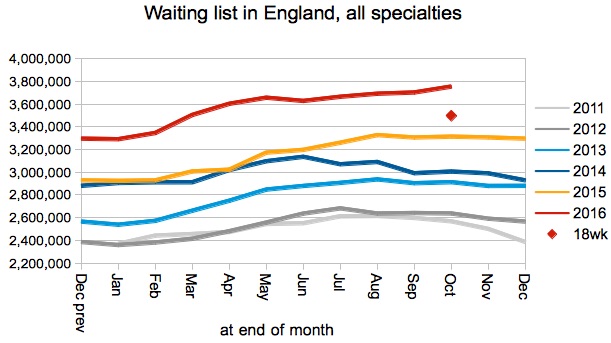
Those who were watching the news when the abolition of NHS England was announced, will have heard the Prime Minister and the Secretary of State for Health congratulating themselves on reducing waiting lists in the winter, because it is more difficult at that time of year. Sounds plausible. But is it true? Alas, if we look back to the years 2011-14 when the waiting list was not growing, we find that the waiting list tends to grow from March to July – not in winter.
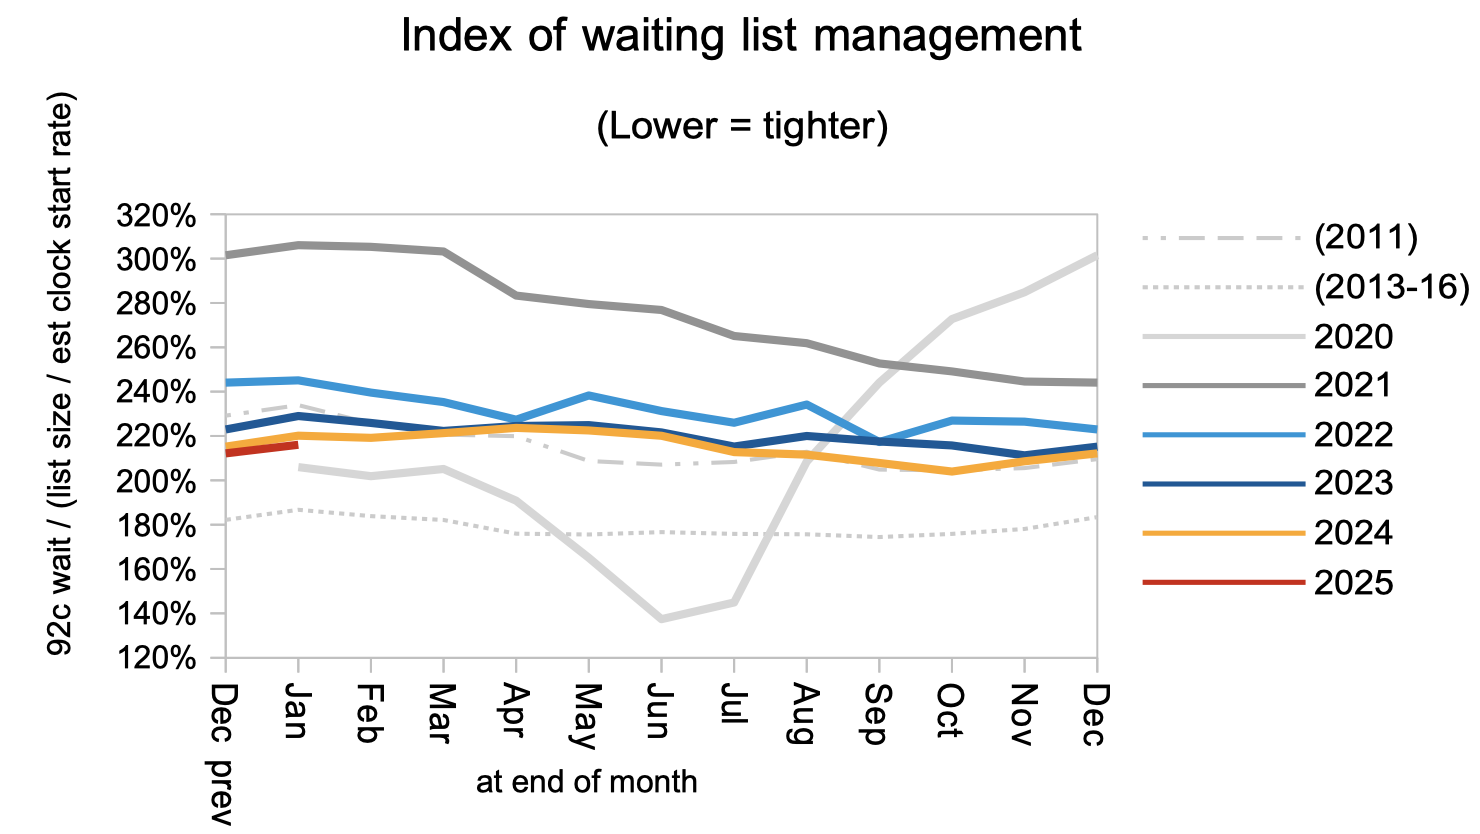
The ‘good waiting list shape’ figure above is based on the 2013-16 grey dotted line in the next chart. Currently the waiting list shape is significantly worse, as shown by the red line, and this should improve naturally as waiting times come down towards 18 weeks. However, NHS England’s decision to set interim milestones based on the percentage within 18 weeks (as opposed to how long 92 per cent of patients are waiting) allows the NHS to leave its most difficult problems to the last minute which may delay improvement.
Waiting times are a function of both the size and shape of the waiting list, and waiting times were the same at the end of January as they were three months previously in October: 42.4 weeks RTT. The waiting time for diagnosis and decision was 40.7 weeks, which is too long for the estimated 27,033 patients whose eventual diagnosis will unexpectedly be cancer.
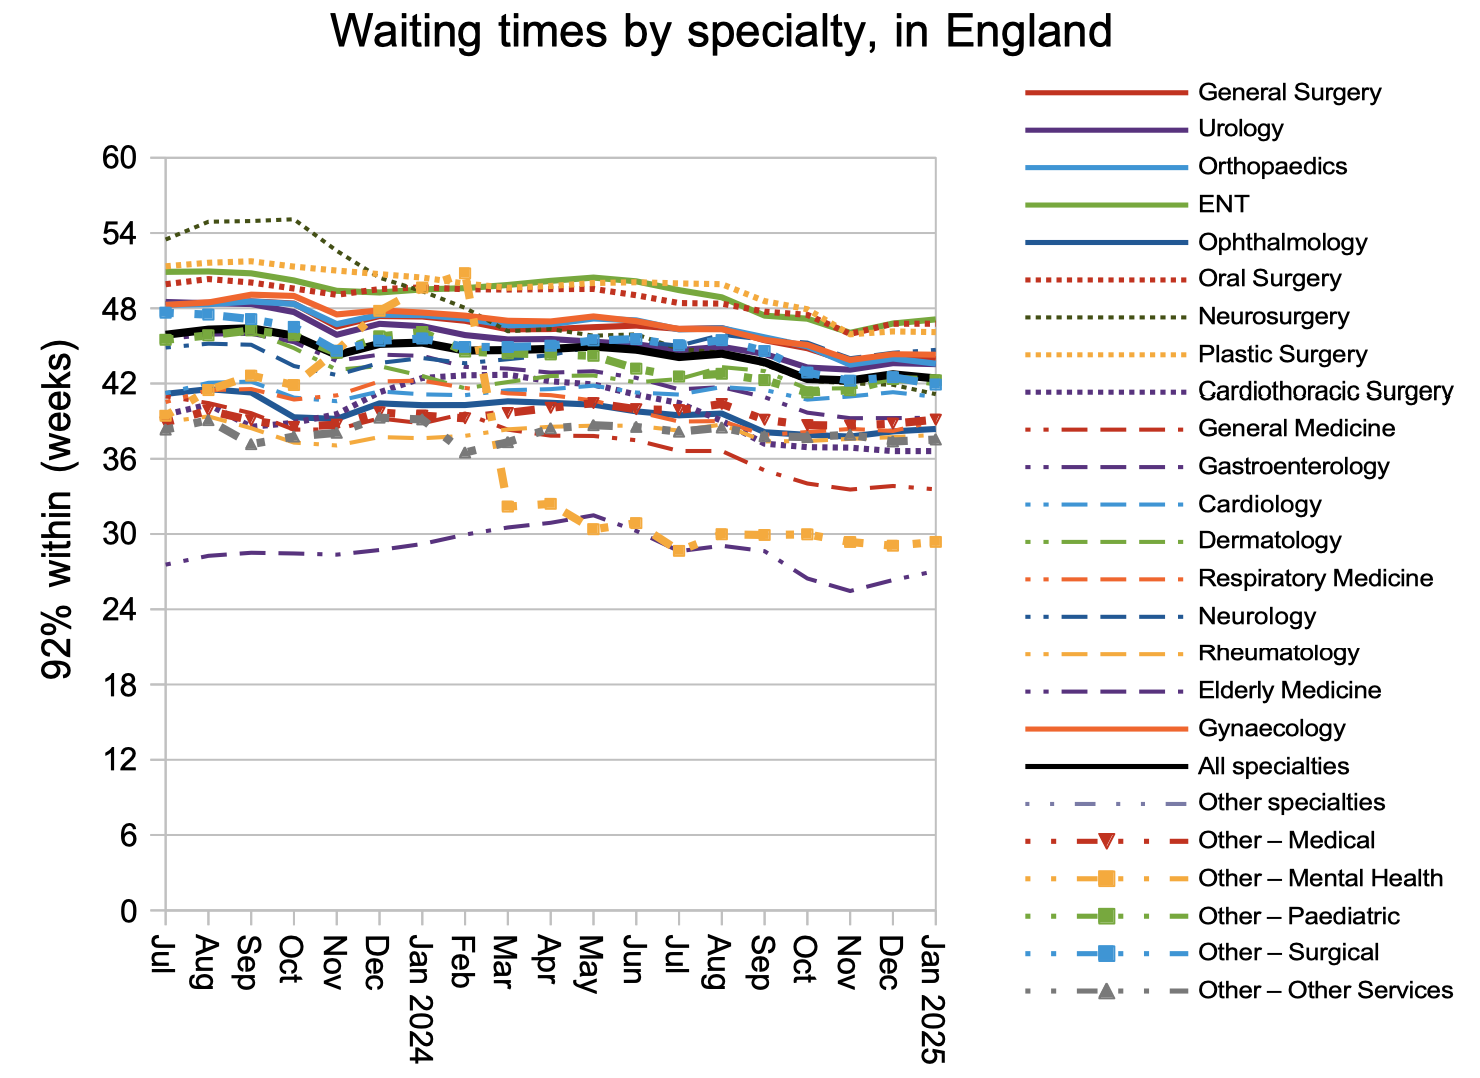
The longest-waiting specialties are still ENT, Oral Surgery and Plastic Surgery.
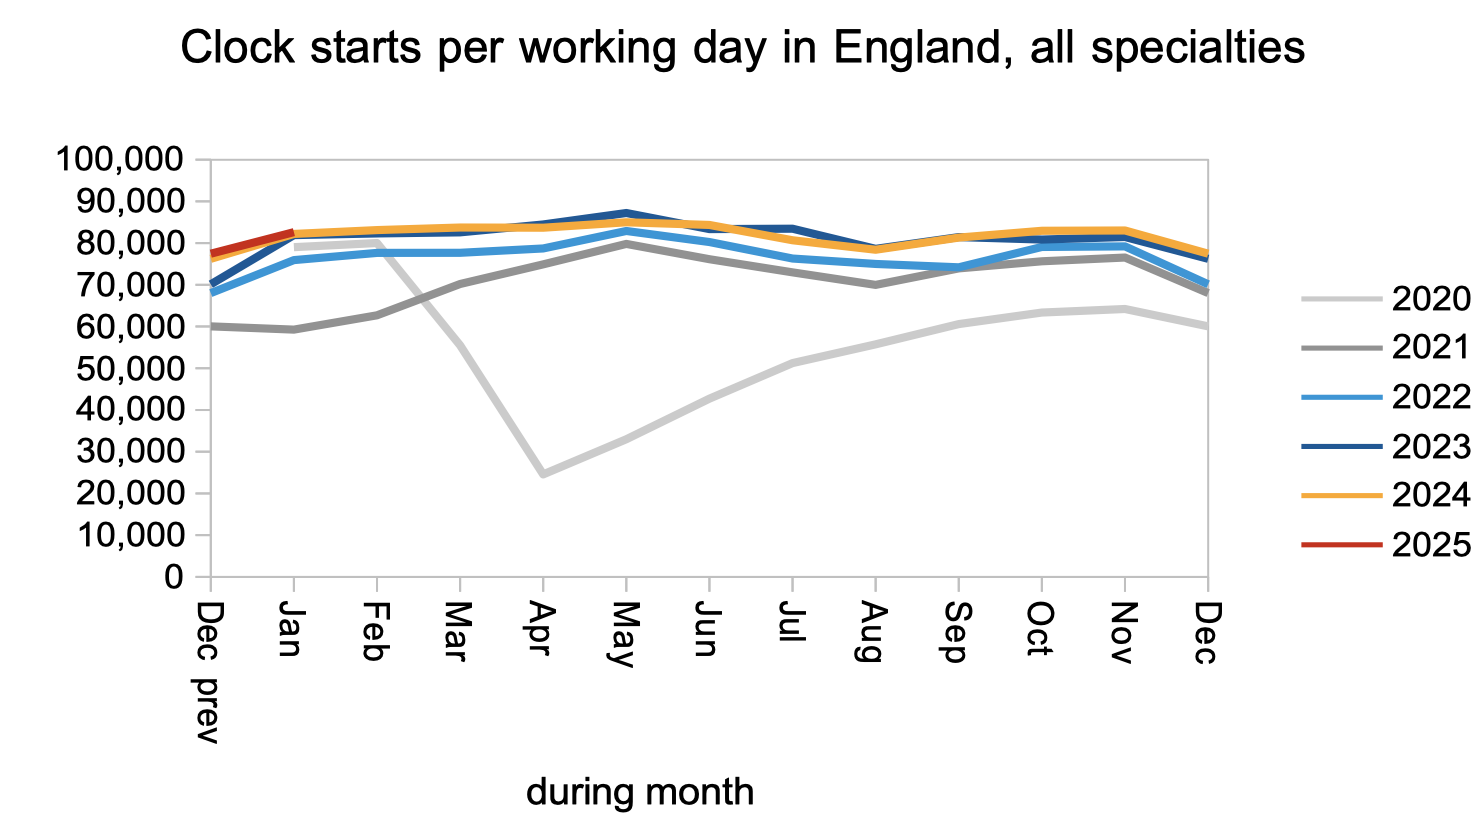
If patients are treated and discharged faster than they are referred, then the waiting list will fall. The referral rate in January was similar to last year, as measured by the rate that patients started new waiting time ‘clocks’.
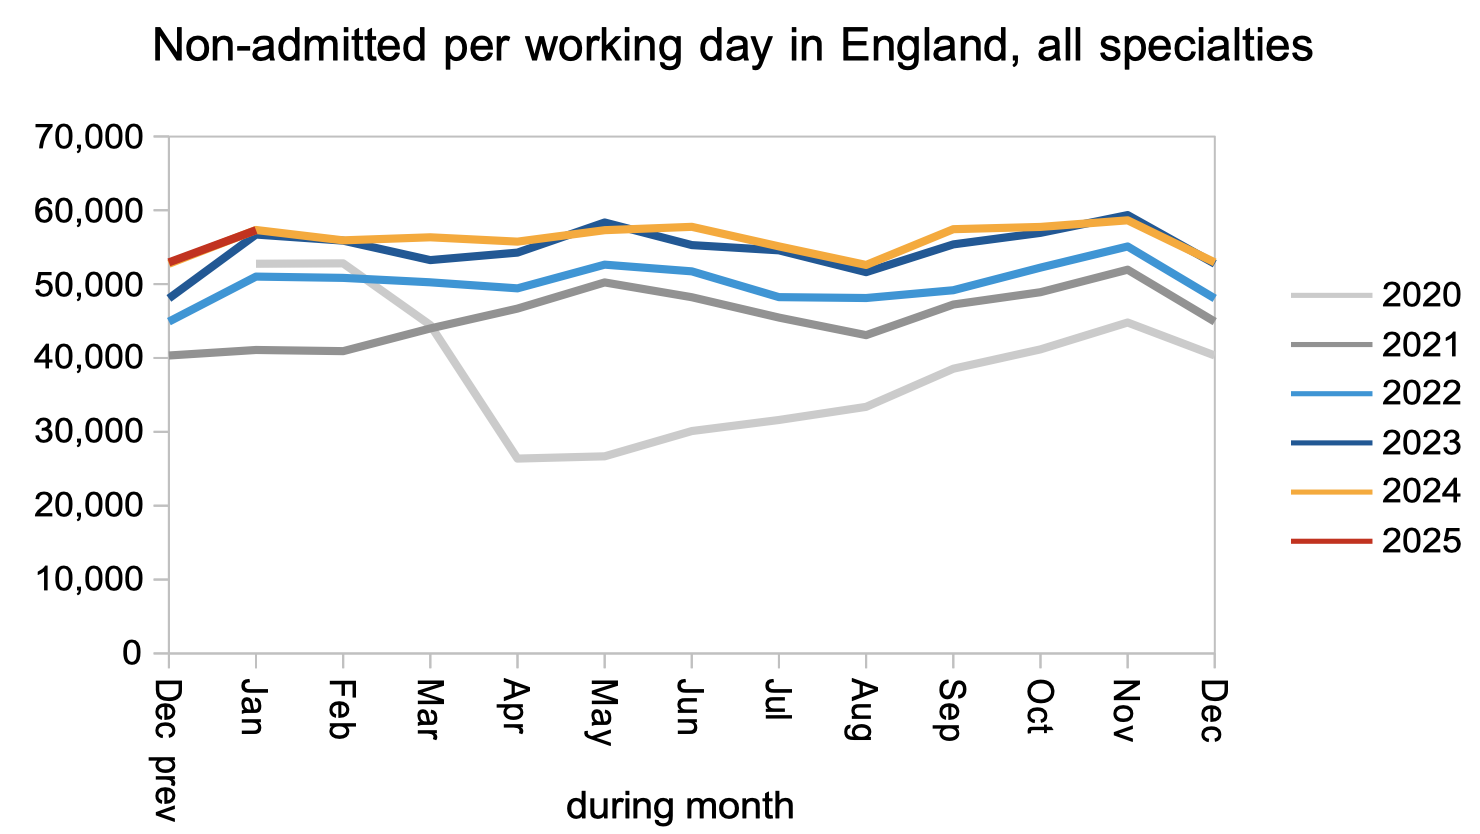
Patients were also discharged from clinic at the same rate as last year, and this is where the NHS should focus efforts, for four reasons. First, this is where the clinical risk is: some of these patients will unexpectedly turn out to have an urgent clinical condition like cancer. Second, this is where the sheer numbers are, and sheer numbers are costly and error-prone to administer. Third, this is low cost-per-case activity so there is plenty of bang for your buck. Last, because this is the lion’s share of the waiting list, improvements will be more noticeable to the local population.
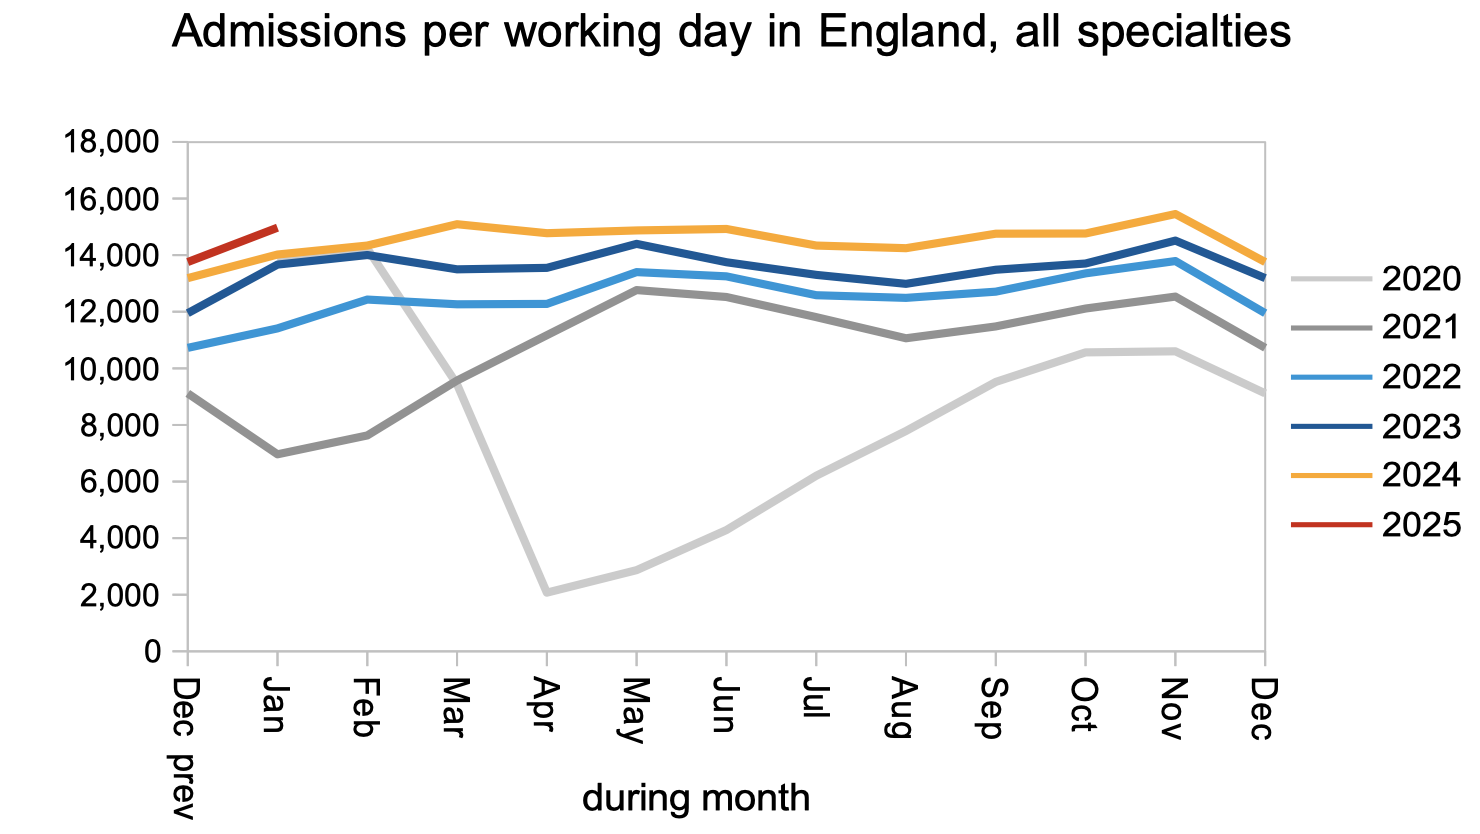
Patients were admitted for inpatient and daycase treatment faster than last year, which is good. Keeping this up will also be important, even if the focus is on outpatients and diagnostics, to avoid building up a backlog of capacity-hungry work that will be difficult to catch up on later.
Referral-to-treatment data up to the end of February 2025 is due out at 9:30am on Thursday 10th April.