Elective waits at your Trust

Up to date analysis of your elective waiting times, and prospects for eliminating 65 and 52 week RTT waits and restoring the statutory 18 week standard:
- Look up your Trust here
- How English Trusts are doing in your specialty
- Where all Trust/specialties are in their recovery
- Click the tabs in the above links for further analyses
Want to understand more?
Validations keep wait list recovery on track

The second half of a major ‘waiting list validation’ exercise kept England’s waiting list reductions on track in May, as hospitals checked and corrected their referral-to-treatment (RTT) waiting lists. The waiting list fell by 30,000 patient pathways during the month, ahead of the 16,000 needed to stay on track.
Bill Morgan – a former Number 10 advisor – predicted last month that this would happen. He suggests that the reductions will come to an end in next month’s figures, when there is no validation drive to offset seasonal waiting list growth, and that the expected resident doctors’ strike will make things worse in July. Which sounds plausible to me.
Also concerning are possible early signs that poorly designed interim targets for the current financial year may be causing a deterioration in the shape of the waiting list. Waiting times depend on both the size and shape of the list, so if the shape slumps then waiting times suffer.
In 2025-26 the NHS is targeting the size of the waiting list and the percentage within 18 weeks, and the NHS dutifully improved on both measures in May. Unfortunately, those targets allow hospitals to delay tackling their most difficult problems to future years, and the deteriorating waiting list shape suggests that this may already be happening. The target to reduce one-year waiters does have a restraining effect, but their increase in May suggests that this may not be sufficient.
Neither the list size nor the percentage within 18 weeks are relevant to individual patients, who care how long they will have to wait, not how many other people are in the same position. For them it was bad news in May, as both overall waiting times and the numbers over 52 and 65 weeks lengthened.
For all of those reasons it would be helpful if, in the planning guidance for next year, the percentage targets (which allow difficult problems to be parked in the remainder) could be replaced with waiting time targets (which must be achieved everywhere).
In the following discussion, all figures come from NHS England. You can look up your trust and its prospects for achieving the waiting time targets here.
The numbers
The English NHS remained slightly ahead of track for 18 weeks recovery, as the chart below shows (the method is explained here). However the recent waiting list reductions in April and May are explained by a major waiting list validation exercise, and keeping up the momentum will require those administrative removals to be replaced with progressing similar numbers of patients towards real treatment and discharge.
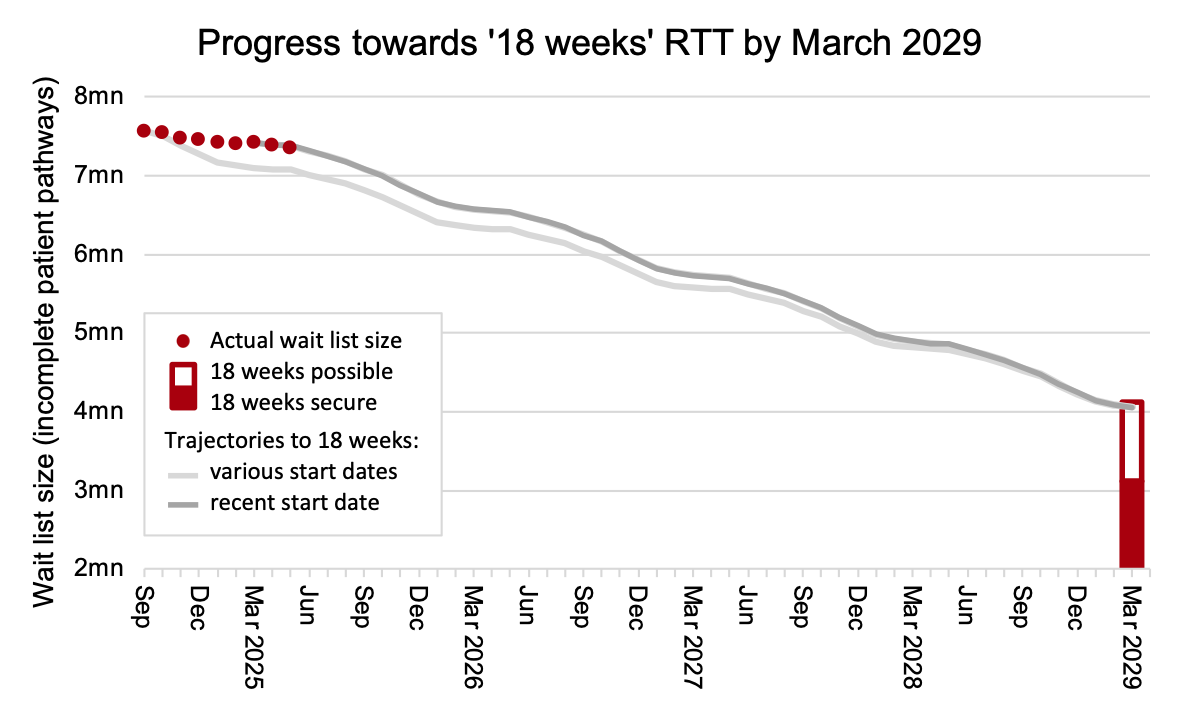
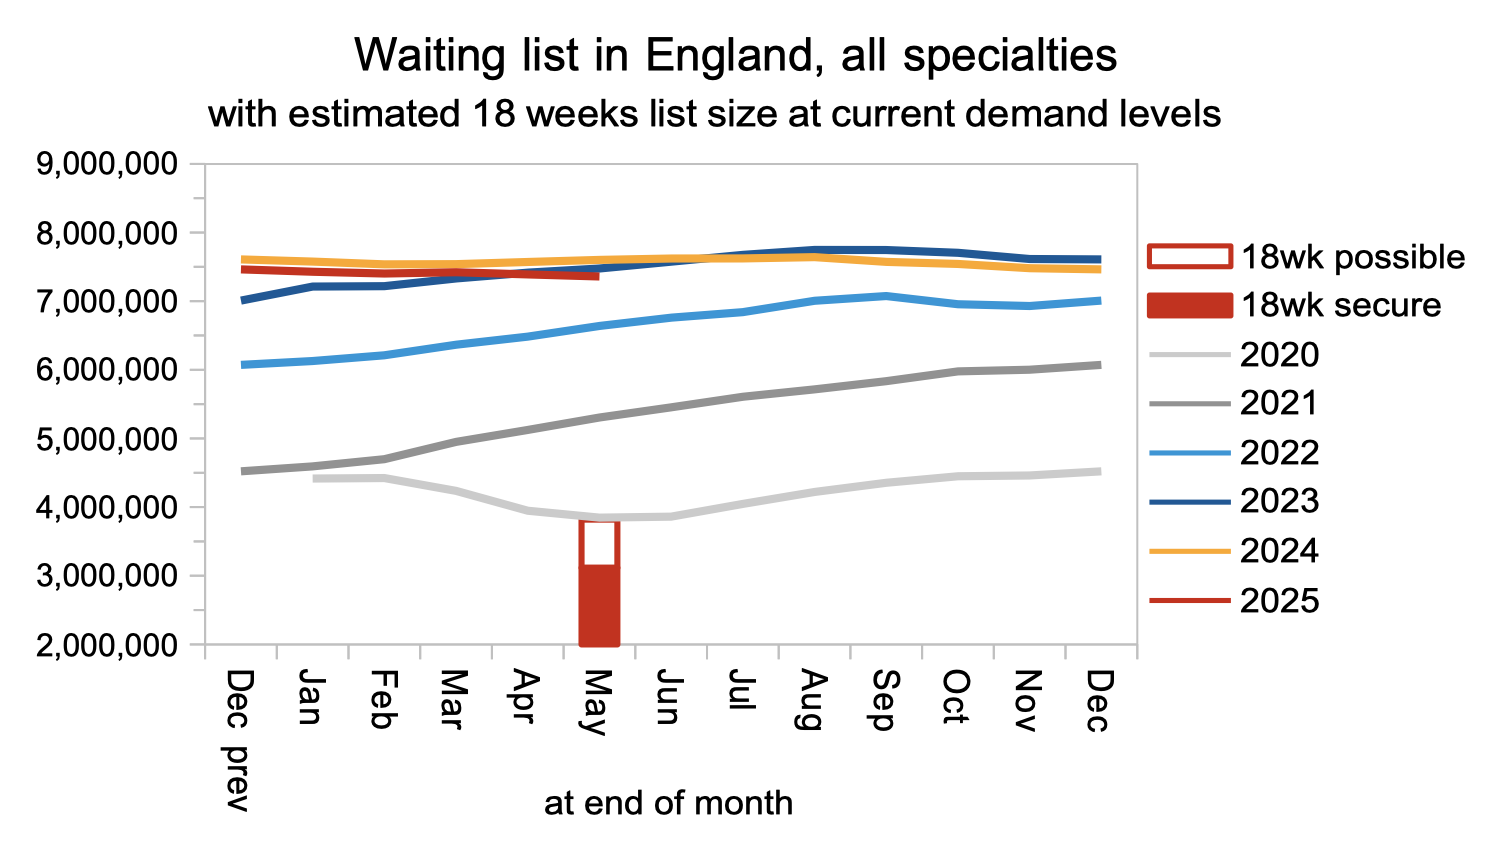
The waiting list continued to fall, and was below its 2023 size. But there is a long way to go. It would need to reach around half that size to achieve the ’18 weeks’ waiting time standard, based on current demand levels.
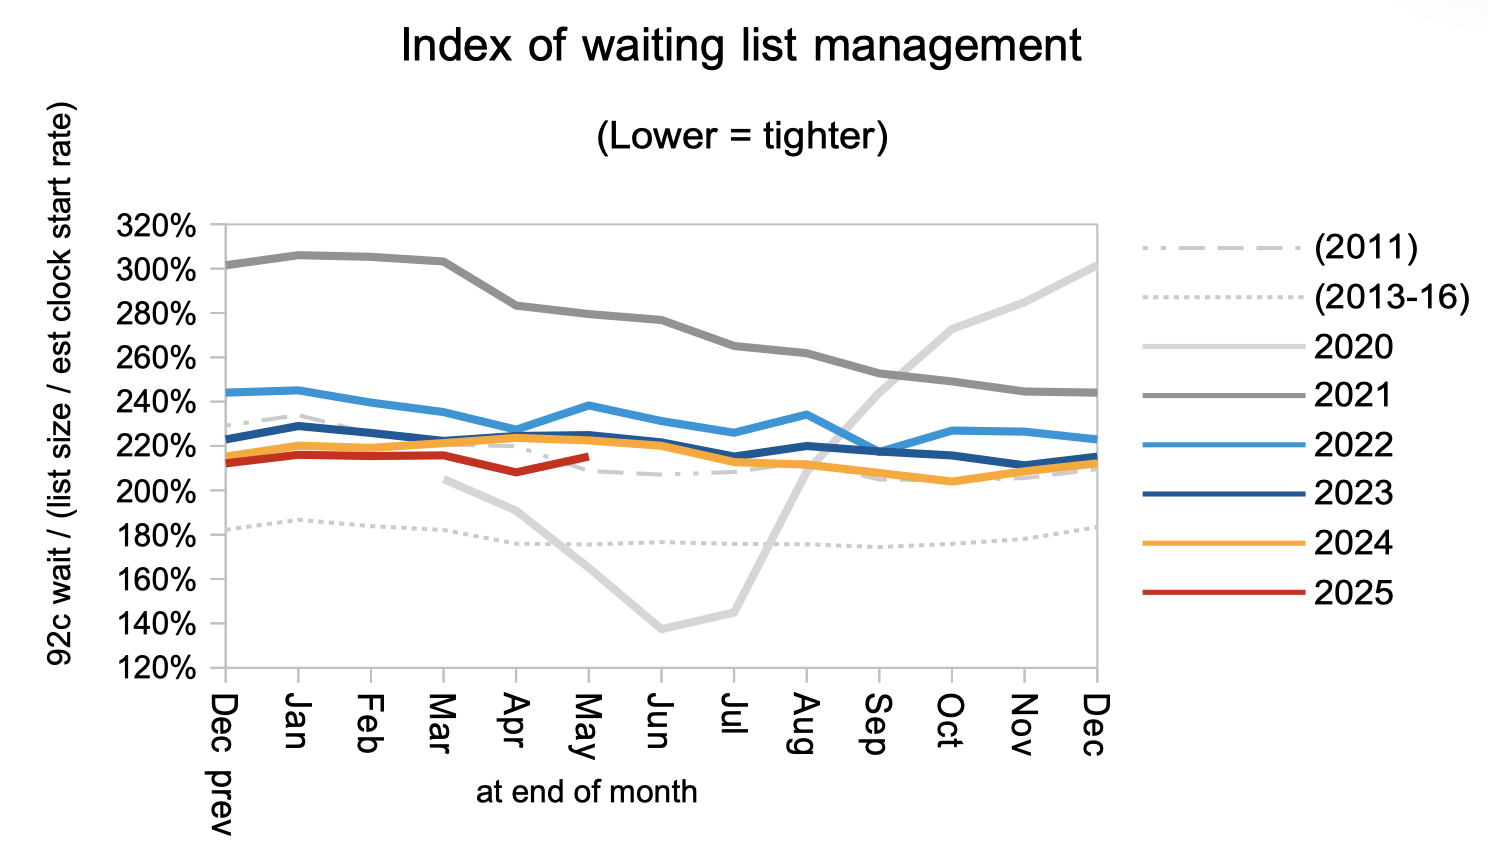
The shape of the waiting list deteriorated in May, in a possible sign that this financial year’s waiting time targets are enabling hospitals to delay tackling their most difficult waiting time problems. This index does fluctuate, and it is too early to call a trend, so we will need to keep an eye on it.
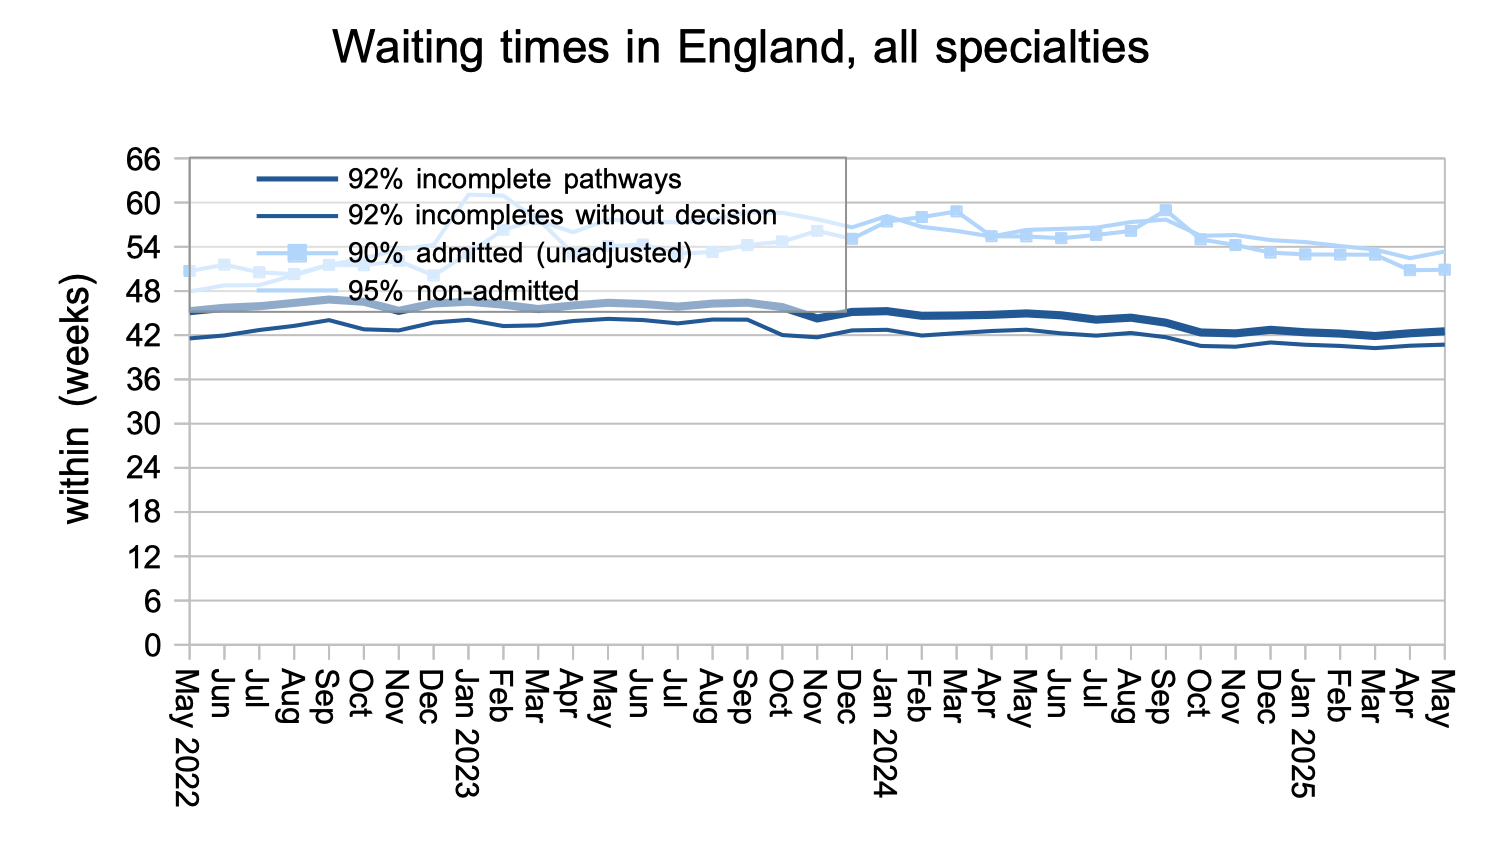
Waiting times deteriorated slightly in May, rising from 42.3 to 42.5 weeks RTT nationally. The number of patient pathways waiting longer than 52 weeks also increased by 6,852 to 196,920 pathways; the proportion of the waiting list exceeding 52 weeks rose from 2.6 to 2.7 per cent, defying the target to reach one per cent by March.
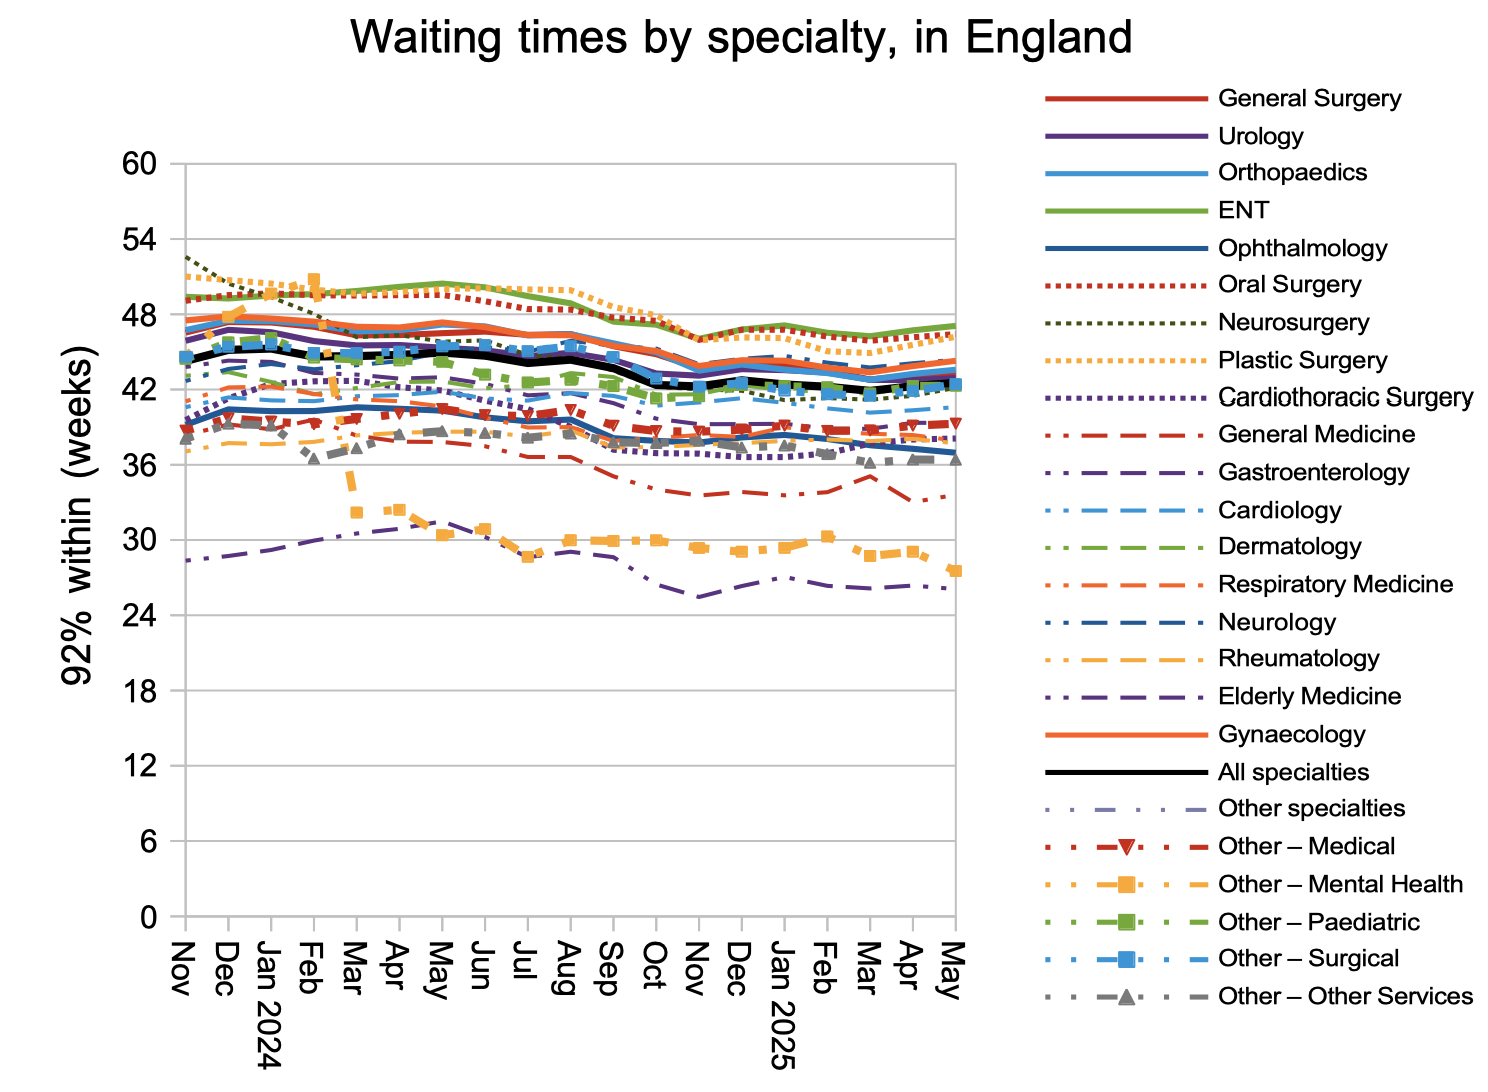
Waiting times generally increased at specialty level too, with ENT remaining the longest waiting specialty in England.
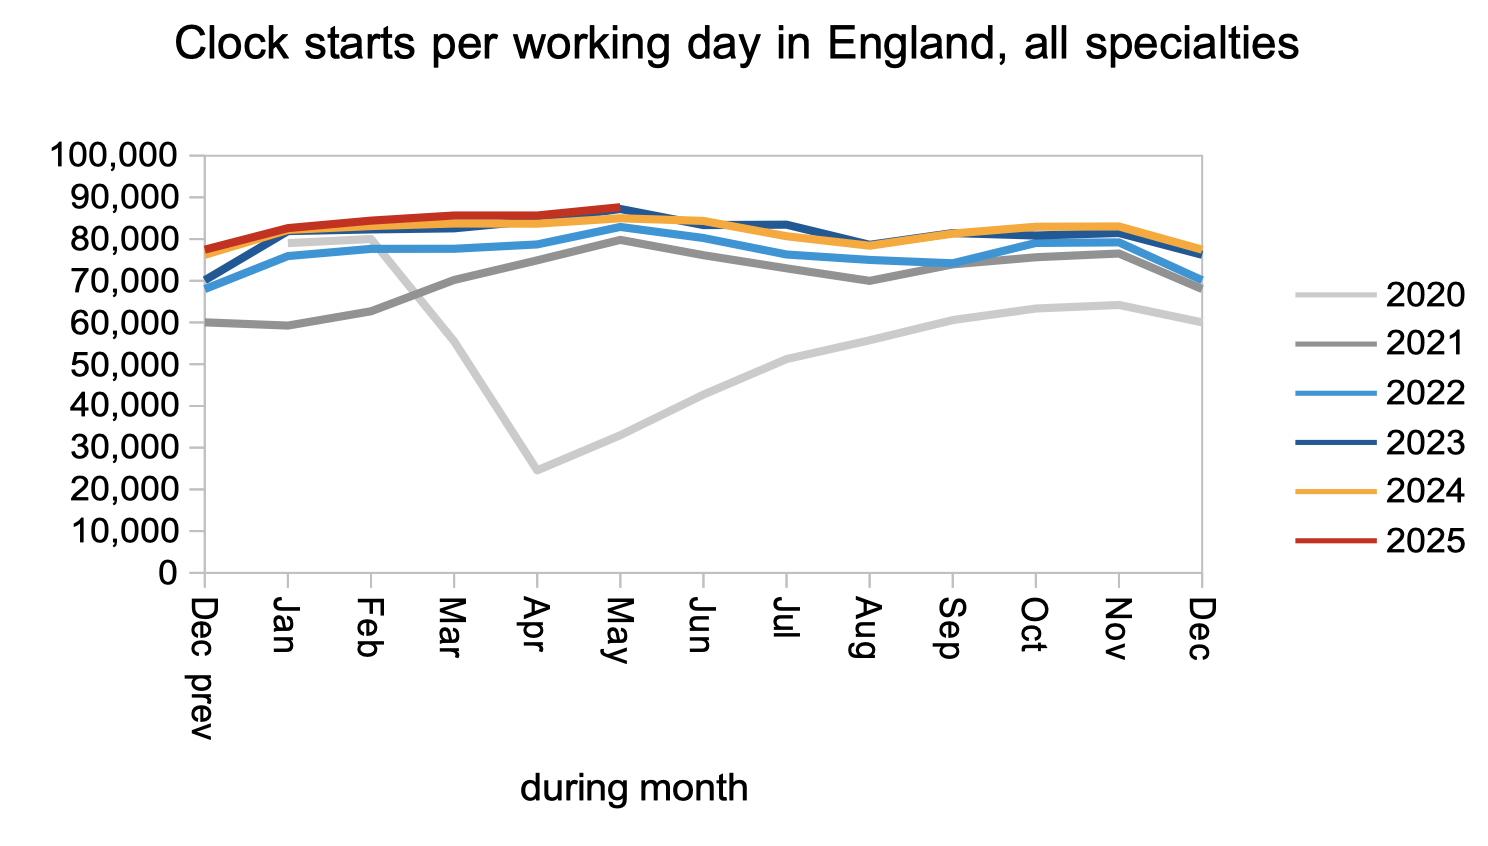
Turning now to the balance of supply and demand, demand remained close to the level of recent years.
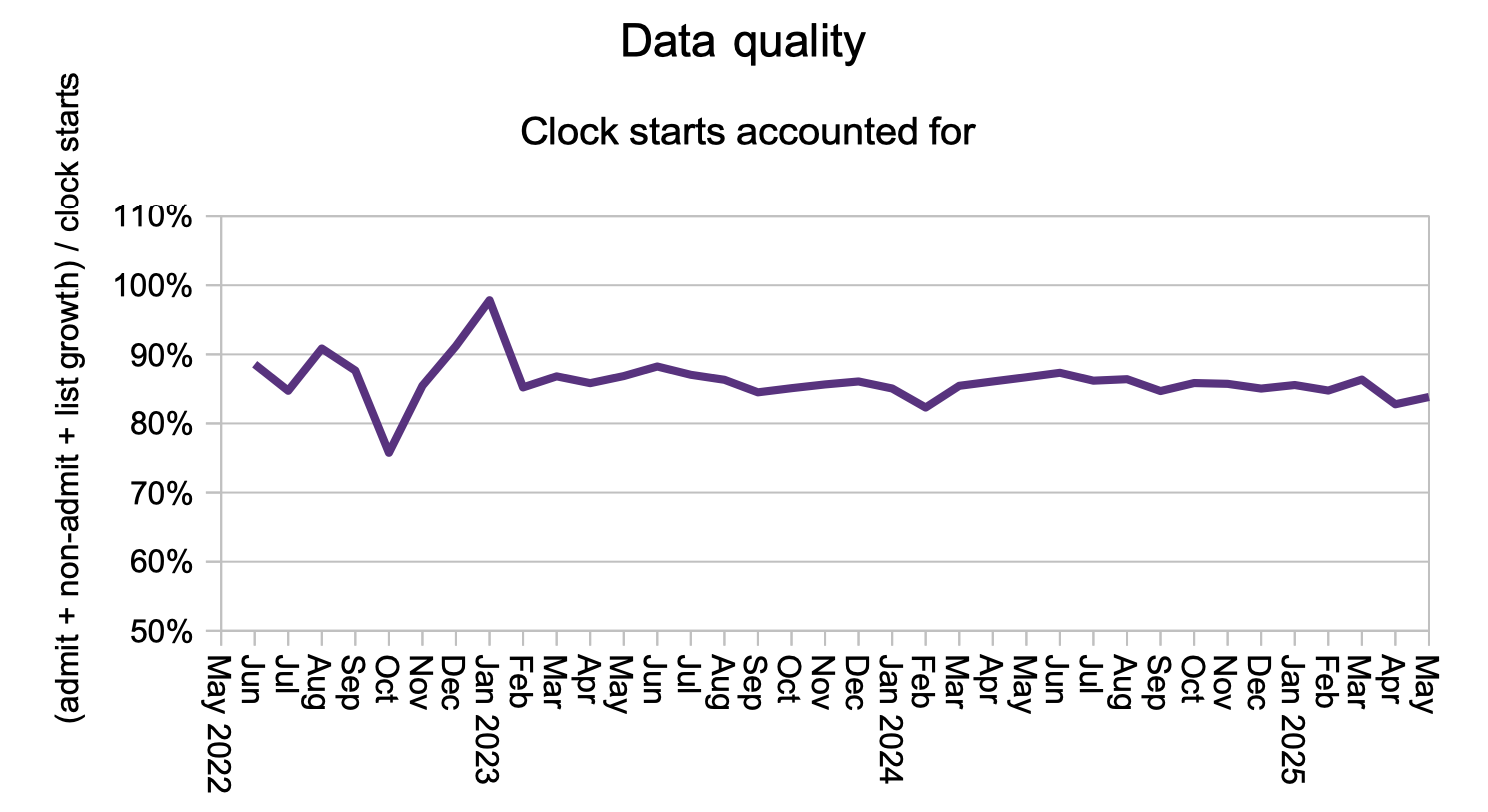
The proportion of patients who disappear from the waiting list without being counted as a ‘clock stop’ recovered slightly from April’s level as the national validation exercise came to a conclusion.
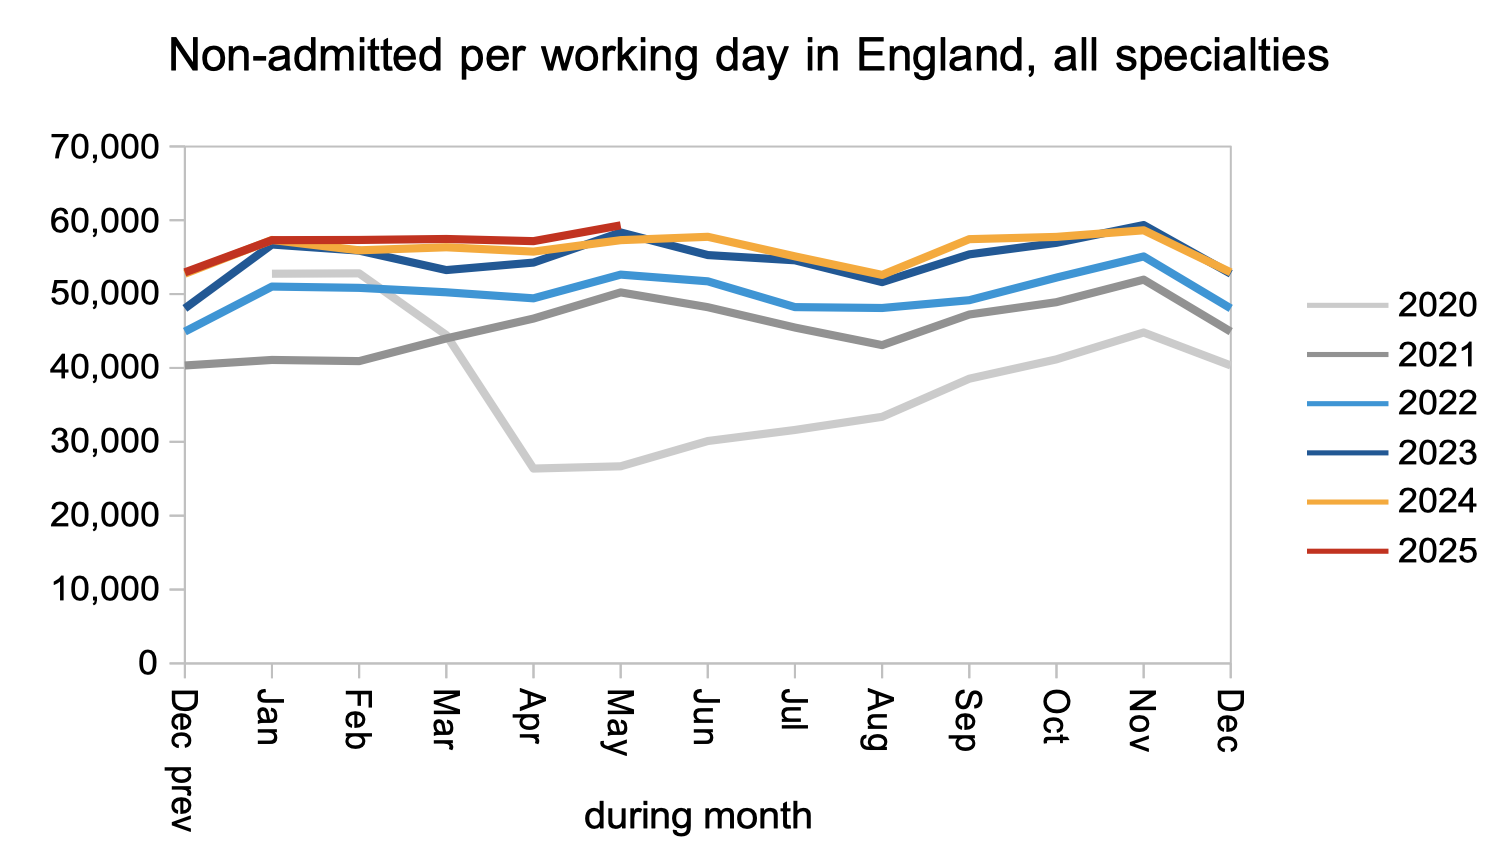
Patients were discharged from outpatients at similar levels to recent years. NHS England are making outpatients a priority, which is sensible for several reasons: this is where the sheer numbers are, undiagnosed patients are at clinical risk, the cost per case is low, the activity is easier to shift out of the acute hospital, there are opportunities for transforming the outpatient and diagnostic process, and the referral and booking process will work a lot better when first outpatient waits are less than the annual leave notice period for doctors.
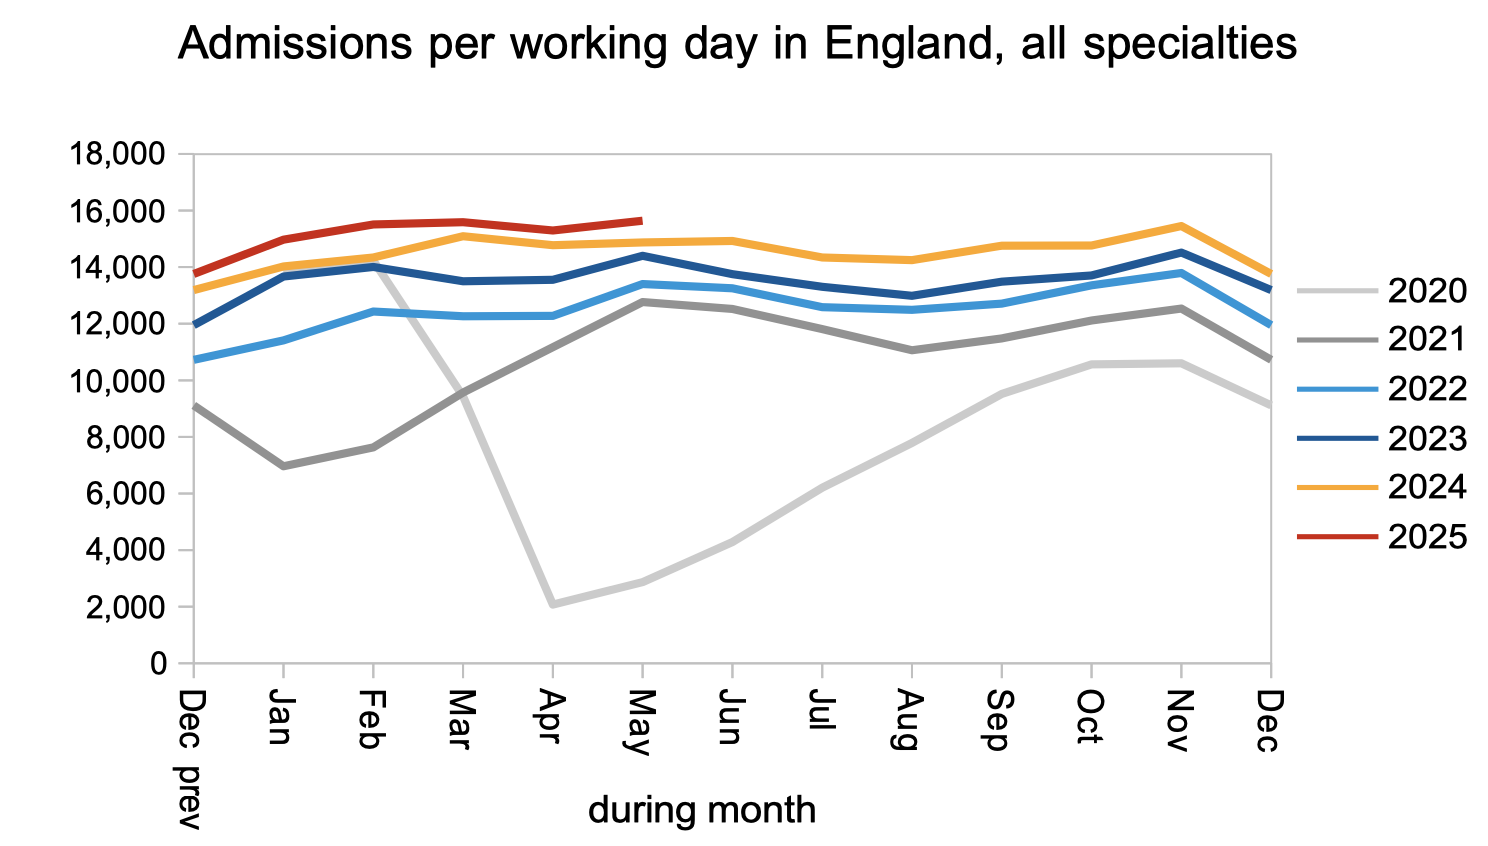
Admissions remained higher than in recent years, which is good news, and needs to continue to keep long waits under control.
Referral-to-treatment data up to the end of June 2025 is due out at 9:30am on Thursday 14th August. With apologies, I will not be here to provide commentary, but I will be back for the next set of data on 11th September.