Elective waits at your Trust

Up to date analysis of your elective waiting times, and prospects for eliminating 65 and 52 week RTT waits and restoring the statutory 18 week standard:
- Look up your Trust here
- How English Trusts are doing in your specialty
- Where all Trust/specialties are in their recovery
- Click the tabs in the above links for further analyses
Want to understand more?
18-weeks recovery stalls as admissions fall

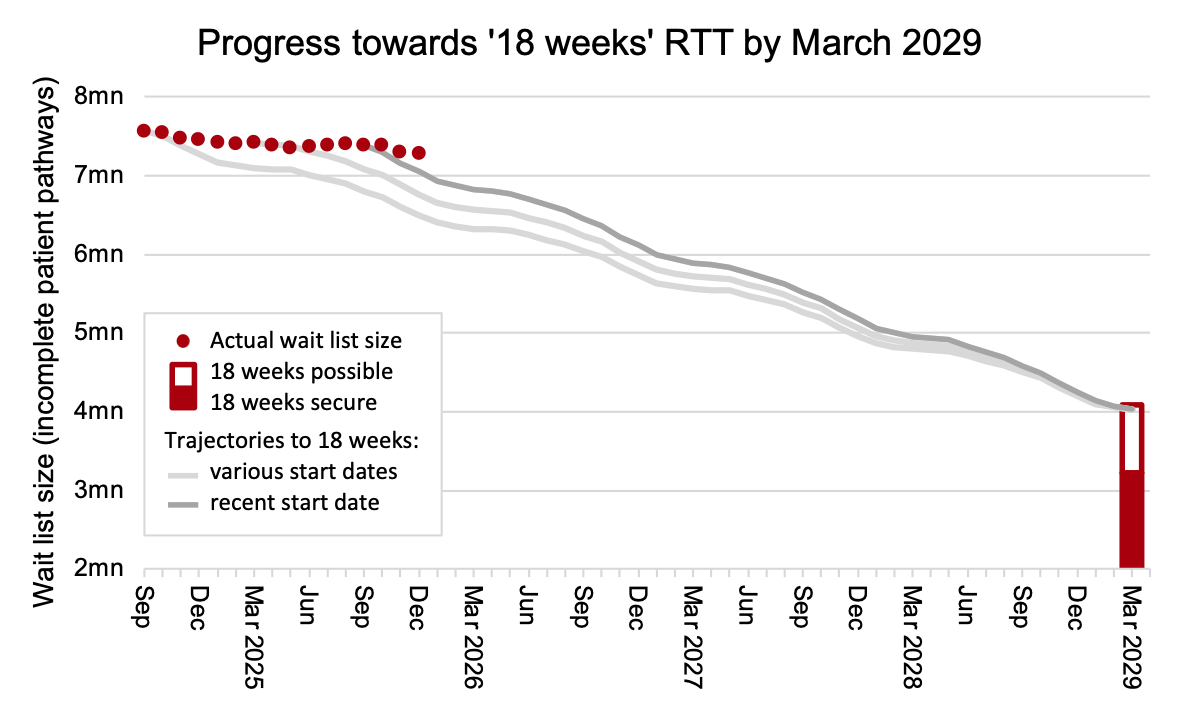
England’s waiting list recovery stalled and referral-to-treatment (RTT) waiting times grew in December, amid a slump in admissions for elective inpatient and daycase treatment.
Seasonal effects would typically cause the waiting list to shrink by around 42,000 patient pathways in December, but it actually shrank by only 18,000, meaning it was in long term growth. This was also far short of the 120,000 reduction that would have put the NHS on track to recover the statutory ’18 weeks’ waiting time standard by March 2029 as the government has pledged.
In recent weeks there has been media speculation that November’s waiting list reduction of 87,000 patient pathways was not caused by the NHS seeing and treating more patients, but instead was caused by validation: a data cleaning exercise in which patients who are recorded on the waiting list in error are deleted from it without showing up in the reported data. In fact, it seems that unreported removals from the waiting list were not particularly high in November (nor, by the way, in December) so there is no clear indication that validations were the cause; however RTT data quality is not great, so it is difficult to draw firm conclusions about this.
In the following discussion, all figures come from NHS England. You can look up your trust and its prospects for achieving the waiting time targets here.
The numbers
The English NHS did not make progress on its ’18 weeks’ recovery in December, meaning that even faster progress will now be required in the time that remains until the March 2029 deadline.
In April and May 2025 the NHS conducted a national waiting list validation exercise, to clean up its waiting list data and remove patients who were recorded there in error. There has been recent media speculation that November’s reductions had a similar cause.
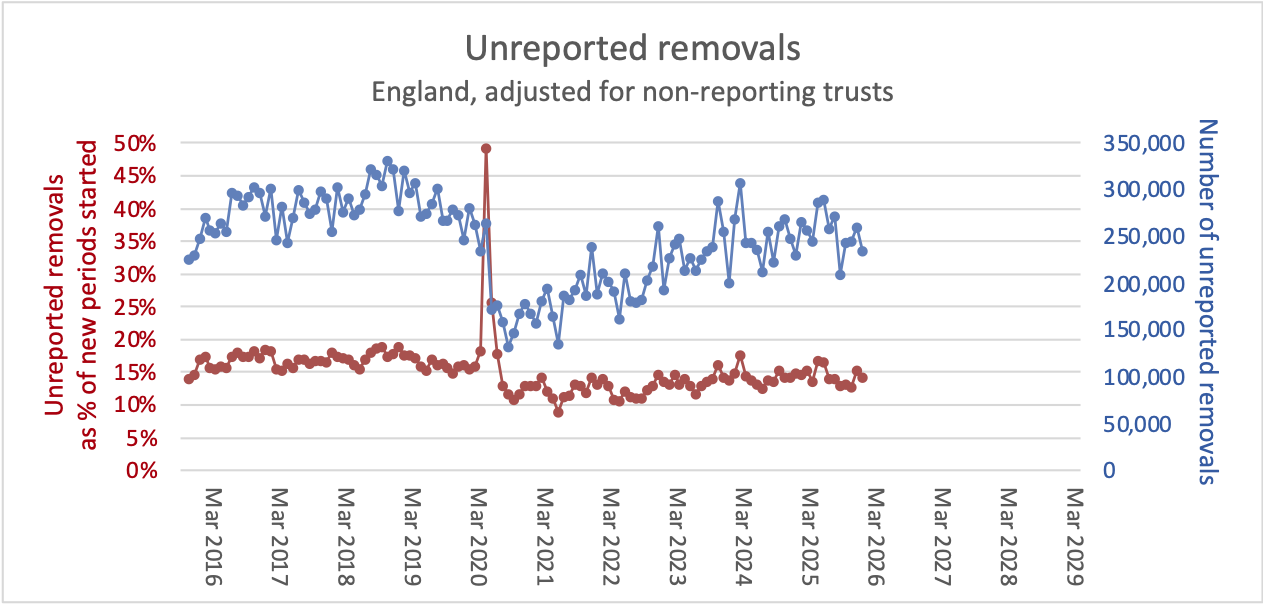
The chart below estimates the number and proportion of unreported removals, by calculating how many removals from the RTT waiting list were unaccounted for during each month. The method is simple, and analagous to reading a bank statement: if you take the opening waiting list at the start of the month, add the new patients coming onto the waiting list, and deduct patients coming off the list as clock stops or as unreported removals, then you should end up with the closing waiting list at the end of the month. It follows that we can estimate the unreported removals as: additions to the RTT list, minus clock stops, minus growth in the RTT list.
The chart shows that unreported removals were high for a couple of months in April and May 2025, both in absolute numbers and as a proportion of new periods (clock starts), when the national validation drive was underway. However November’s figures are unexceptional, so there is no indication of a major validation effort that month.
The rest of the charts below are not adjusted for non-reporting trusts, nor do they take in the data revisions from April 2025 onwards which were published alongside the latest data.
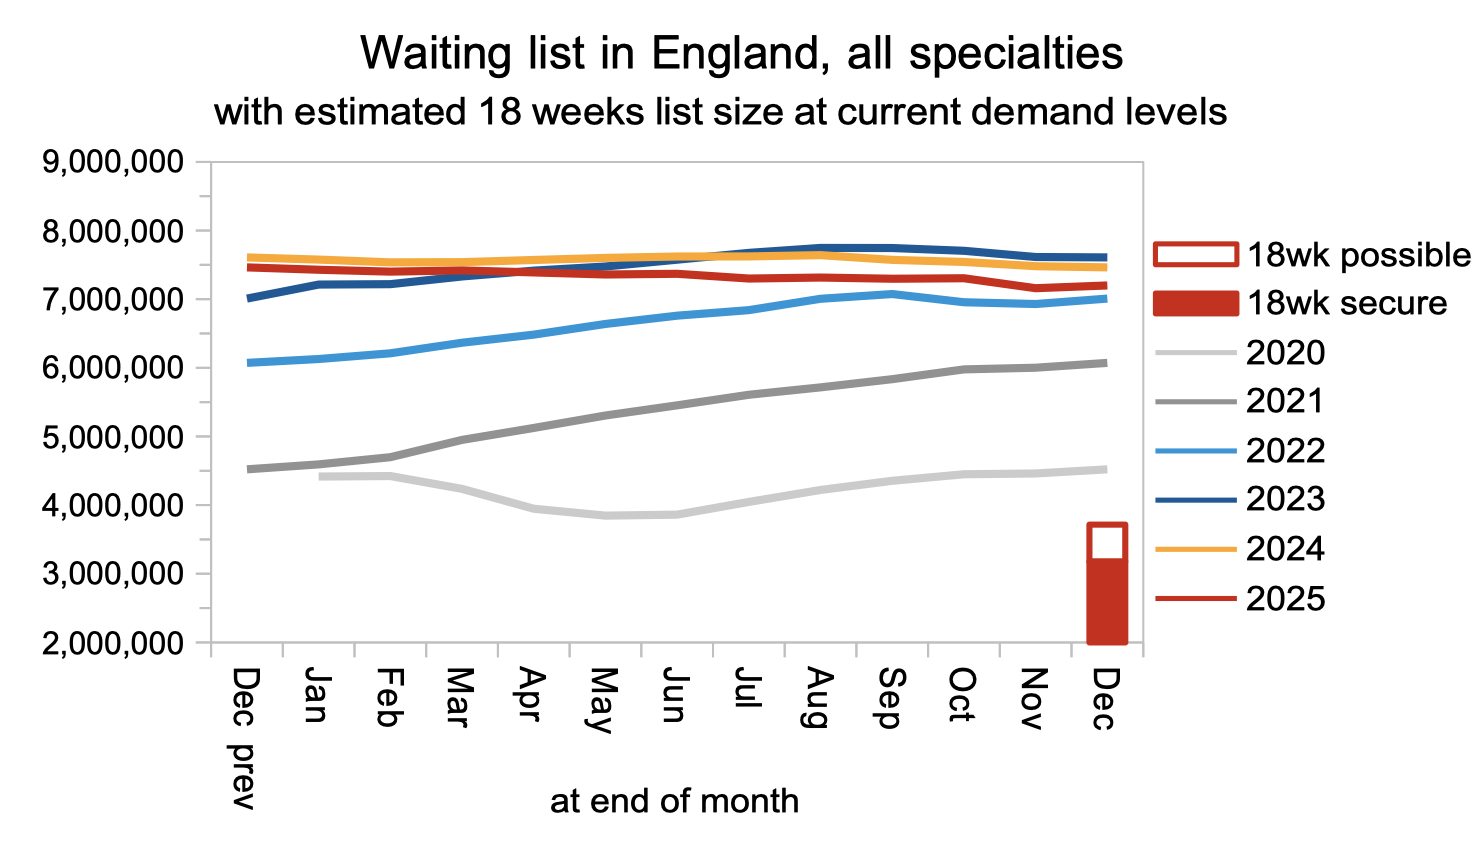
The waiting list has been falling but only slowly. As Chart 3 of the official news release shows, admissions for inpatient and daycase treatment fell sharply in December, contributing to the poor performance on waiting lists and times.
Waiting times rose by 0.4 weeks in December, both overall and for those patients who have not yet reached diagnosis and decision to admit. Among the latter (who contribute more than 6 million pathways to the 7.3 million on the overall RTT waiting list) are an estimated 26,124 patients whose eventual diagnosis will unexpectedly be cancer.
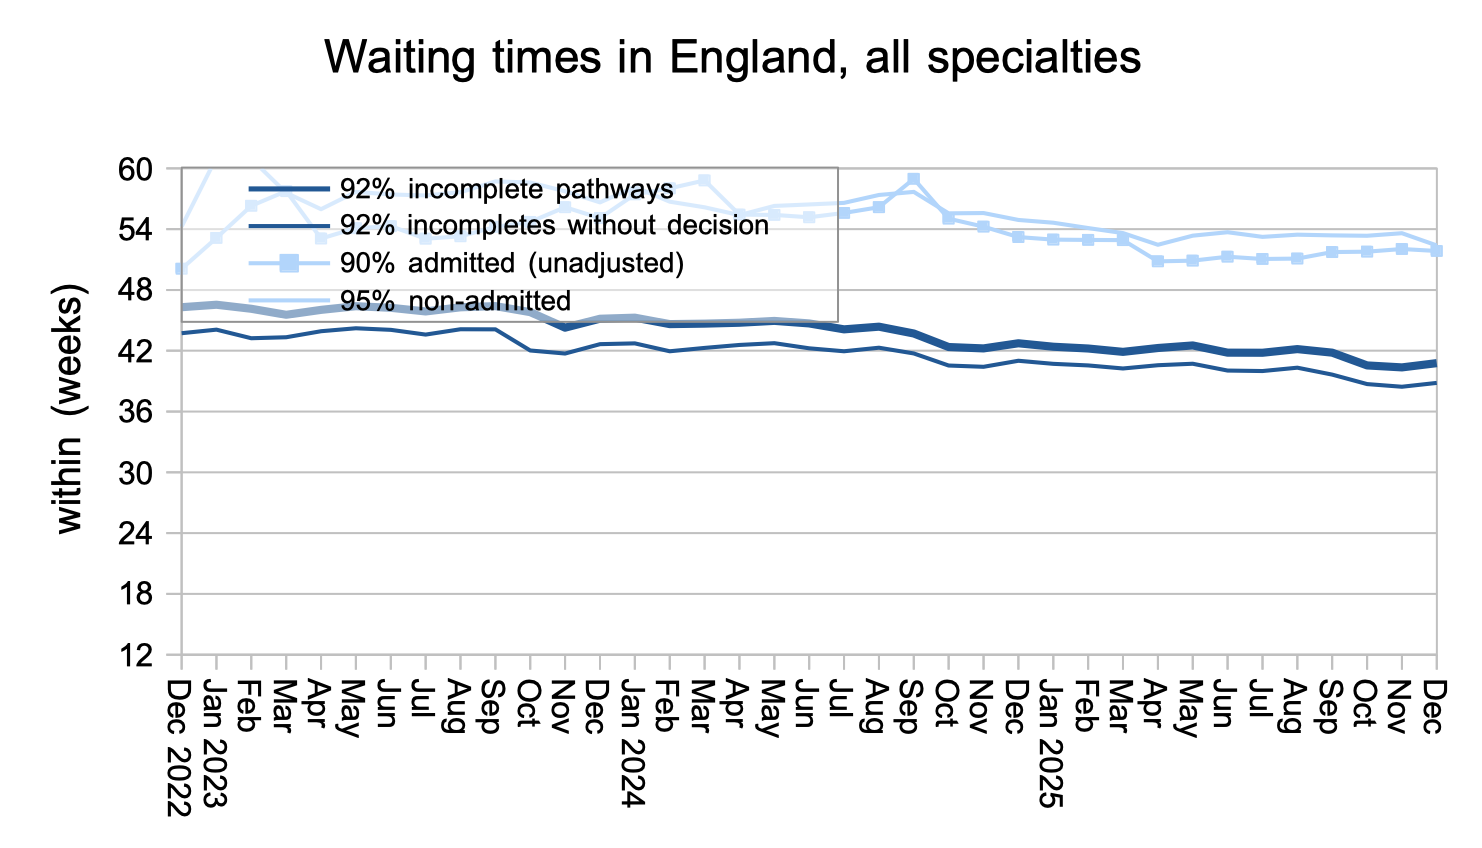
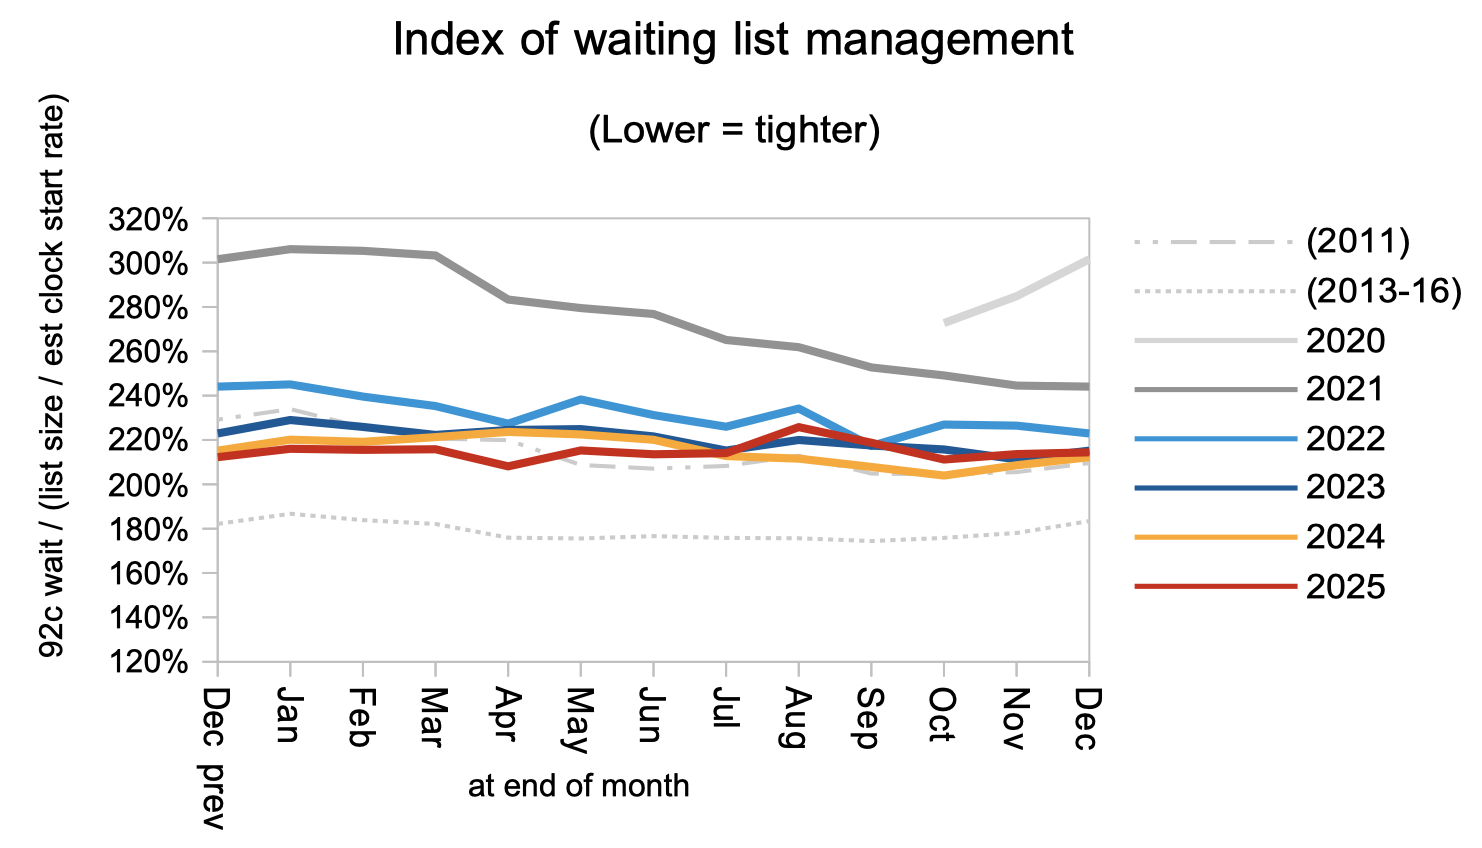
Waiting times are a function of both the size and shape of the waiting list, and the next chart is a measure of the shape. It remains at pre-2011 levels. The first (‘progress’) chart above assumes the shape will improve to 2013-16 levels so that ’18 weeks’ can be achieved with a list size of around 4 million (which is also consistent with NHS England’s estimate).
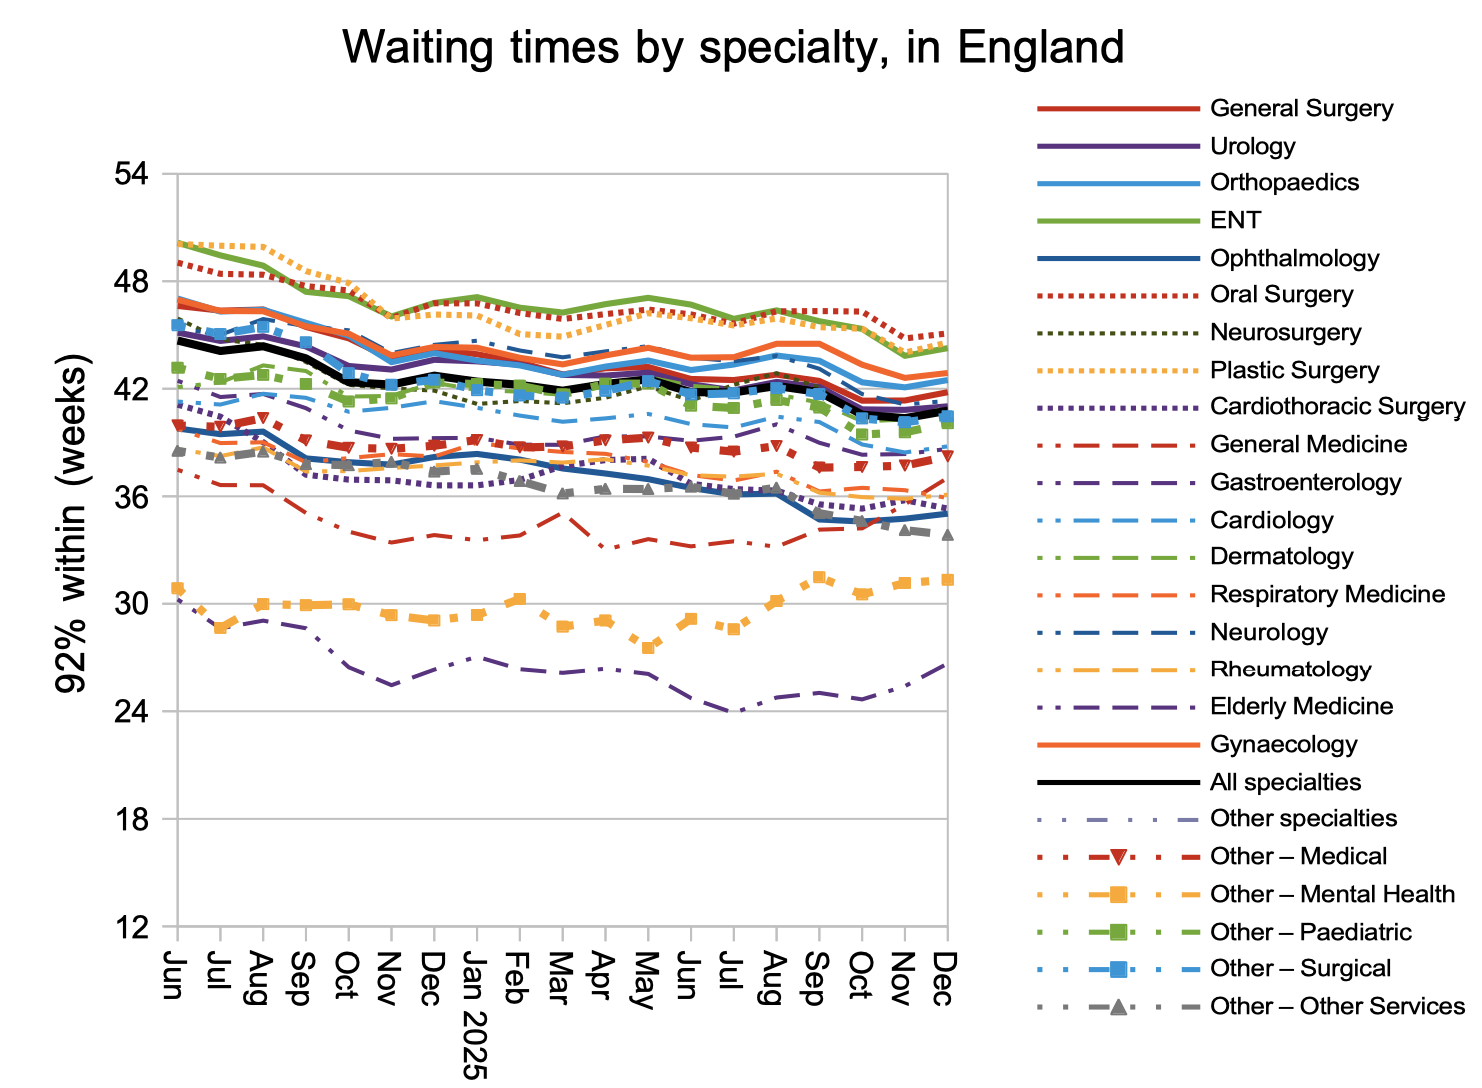
The general uptick in waiting times was shared by most specialties. Waits remain particularly long for disorders from the neck up.
Referral-to-treatment data up to the end of January 2026 is due out at 9:30am on Thursday 12th March.