Tracking progress towards ’18 weeks’

In June 2025 I introduced a progress chart, like the one below, into my monthly referral-to-treatment (RTT) waiting times report. This post explains it.

The chart shows whether the waiting list is shrinking fast enough to restore the statutory ’18 weeks’ standard by March 2029 as the government has pledged. The data source is the latest “RTT Overview Timeseries Including Estimates for Missing Trusts” spreadsheet, published each month by NHS England statisticians.
Actual wait list size
The row of red dots, starting from the upper left, shows actual RTT waiting list sizes over time. They are based on NHS England’s count of incomplete patient pathways at the end of each month, and (unlike other charts in my regular monthly report) they include estimates for any missing data.
List size to restore 18 weeks
Over at the lower right, the red column estimates how small the waiting list needs to become to restore the 18 weeks standard at the end of March 2029. There is uncertainty about this, so the column is split into two parts.
The solid part shows where delivery of 18 weeks should be secure.
The hollow part shows the range of list sizes where it is possible to achieve 18 weeks, depending on the shape of the waiting list and annual demand growth. The lower end of the range assumes that the waiting list shape is the same as in the latest data, with zero demand growth up to 2029. The upper end assumes a good waiting list shape (the averaged achieved from 2013-16), after 3 per cent annual demand growth up to 2029.
The waiting list shape scenarios contribute a little over half the range shown by the hollow part, with the demand scenarios making up the balance.
Trajectories to 18 weeks
The grey lines show trajectories from various starting points, up to a potential restoration of 18 weeks at the end of March 2029. Every six months, a new trajectory will be added to show how the scale of the government’s challenge is evolving.
The end point of each trajectory is the latest estimated waiting list size that would restore 18 weeks, with a good waiting list shape, after 2.5 per cent annual demand growth (which is roughly the growth rate observed before the pandemic).
Each line is constructed by deseasonalising the start and end points, drawing a straight line between them, and then adding the seasonality back in. The seasonality was calculated by detrending, zero-basing, and averaging waiting list sizes across the calendar years 2011-19.
Calculation of waiting list size consistent with 18 weeks
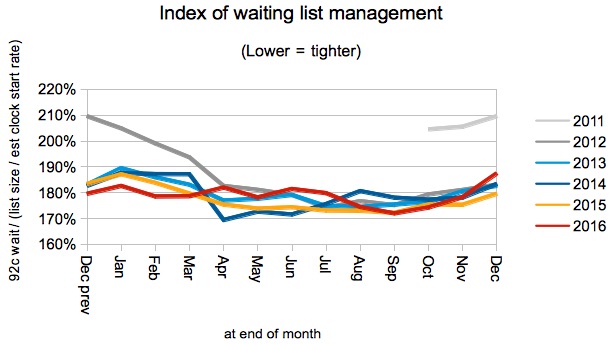
Waiting times are a function of both the size and shape of the waiting list. I report the waiting list shape in my monthly reports, in the form of an index of waiting list management, and am using the same method here but based on different data. For instance, here is the index chart from my monthly report on the March 2025 data, which includes the wild swings during the COVID-19 lockdowns of 2020-21.

The index is calculated using a method based on Little’s Law, and equals:
92nd centile waiting time in weeks / (waiting list size / smoothed clock start rate)
This index has the advantage of being stable relative to demand growth, allowing comparisons to be made over long time periods.
The tricky bit is estimating the clock start rate, because this data is error-prone. Also, clock starts have only been published since October 2015, and the analysis needs to include the good waiting list shape that was achieved from 2013 to 2016, because it can and should be achieved again. The chart below shows the index across that period, starting with the dramatic improvement in early 2012 that was triggered by the announcement of the ’92 per cent of incomplete pathways within 18 weeks’ target, which delivered the NHS’s shortest ever RTT waiting times and remains the statutory standard today.
To avoid the problems of wrong and missing data in my monthly report, I estimate clock starts by interpolating the 1-7 week waiting list cohorts back to the axis. Unfortunately cohorts are not available in the source I am using for the present calculations, so instead I use the published clock start rate, and adjust it so that on average it is consistent with the historical cohort-based values; the adjustment reflects patients who quickly disappear from the waiting list without scoring as clock stops.
The clock start rate is then smoothed over the most recent 4 months, so that it is reflective of the waiting list up to 18 weeks.
The waiting list size that is consistent with the 18 weeks standard and the current waiting list shape is simple to calculate. In the formula above, the smoothed clock start rate is the same for both the current waiting time and the desired 18 week waiting time, so:
wait list size for 18 weeks / 18 weeks = current wait list size / current 92% wait time
=> wait list size for 18 weeks = current wait list size * 18 weeks / current 92% wait time
The waiting list size that would achieve 18 weeks, if the waiting list shape improved to the good 2013-16 levels in time for the deadline, is then calculated as:
wait list size for 18 weeks calculated above * current index / 182%
…where 182% is the average March index for 2013-16.
The index formula above shows that, for a constant waiting list shape and waiting time, the waiting list size is proportional to the clock start rate. The clock start rate grows in line with demand. Therefore the waiting list size consistent with 18 weeks also grows in line with demand (as we would expect from an understanding of Little’s Law). So the desired waiting list sizes are inflated by trend demand growth, compounded over the time remaining to March 2029.
These calculations are updated in each monthly report with the latest data, so the waiting list size consistent with achieving 18 weeks by March 2029 will alter slightly as new data comes in. In the chart above, with the March 2013-16 waiting list shape and 2.5% annual demand growth, the trajectory end point comes out as 3,980,897. This is consistent with NHS England’s estimate of “just under four million”.
What could go wrong?
How might the government’s pledge be missed?
The most obvious scenario is a failure to shrink England’s waiting list fast enough, because of activity failing to exceed demand by a large enough margin. The possible causes are well known, and well rehearsed at every NHS financial planning opportunity.
But there is another possibility – a poor waiting list shape – which could happen in several ways:
- Encouraged perhaps by poorly designed interim targets, the NHS could put off tackling its most challenging waiting lists (or patients) until the later years, and then find they have left it too late.
- Inaccurate planning could send limited resources to services that don’t really need them, starving those that do.
- Some specialties and/or regions may suffer systemic capacity shortfalls that cannot be rectified regardless of resource.
- Inaccurate and incomplete patient pathway data on a significant scale could be discovered as the deadline approaches, leading to an unexpected inflation in the number of long waiters.