Wait list falls but still not fast enough

The English referral-to-treatment (RTT) waiting list shrank by 87,000 patient pathways in November, reversing the general growth of recent months, and beating the usual seasonal reduction of 54,000. However November’s improvement still fell short of the 133,000 required for 18 weeks recovery by 2029.
Waiting times (which are what matter to patients) fell slightly by 0.2 weeks to 40.4 weeks RTT, with the biggest improvements seen in the longest-waiting specialties. For those patients without a diagnosis and decision to admit, waiting times fell slightly faster, by 0.3 weeks to 38.4 weeks, which is a small improvement for the estimated 26,004 patients whose eventual diagnosis will unexpectedly be cancer.
In the following discussion, all figures come from NHS England. You can look up your trust and its prospects for achieving the waiting time targets here.
The numbers
The latest trajectory towards 18 weeks recovery by March 2029, shown by the dark grey line that starts at the end of September, required the waiting list to shrink by 133,239 patient pathways in November. The waiting list actually shrank by only 86,517 (allowing for non-reporting trusts), falling short of the trajectory but beating the usual seasonal fall of about 54,000.
What does that mean? It means that, in November, the waiting list really did make progress towards restoring the 18 weeks standard, but not fast enough to achieve it by March 2029.
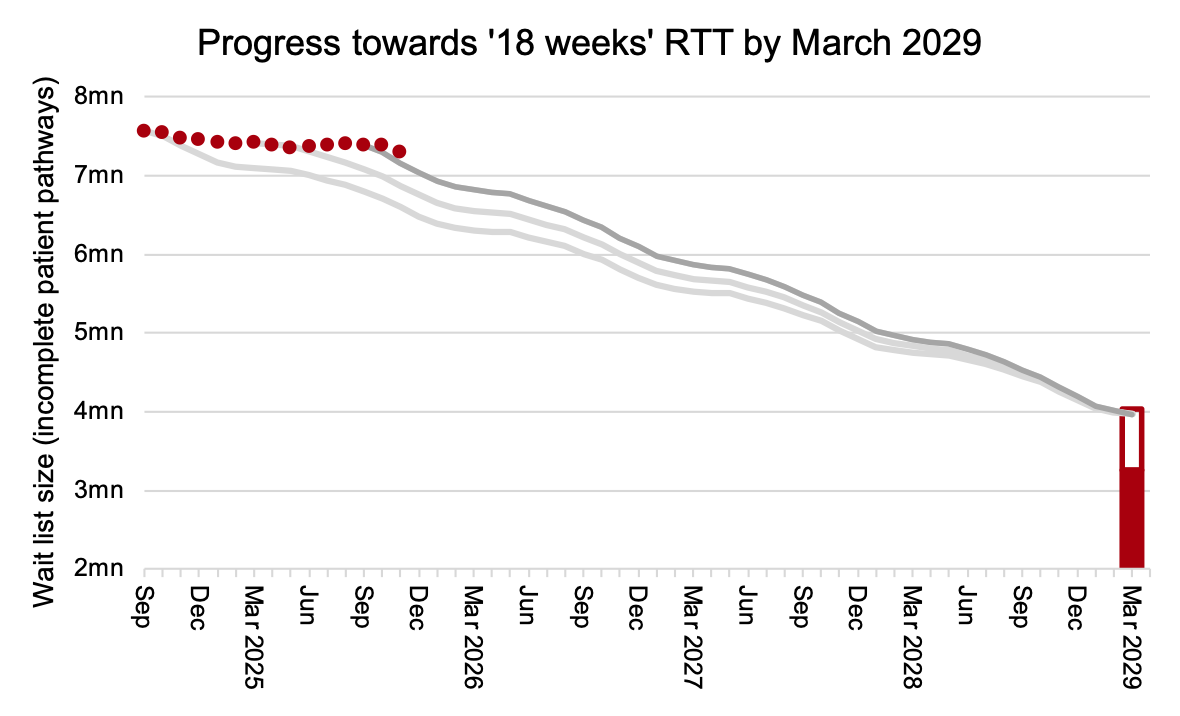
The remaining charts do not allow for non-reporting trusts; a further 59,000 patient pathways disappeared from the waiting list in November. So the waiting list did shrink, just not quite as sharply as shown in the chart below.

As the waiting list edges down, so do waiting times.

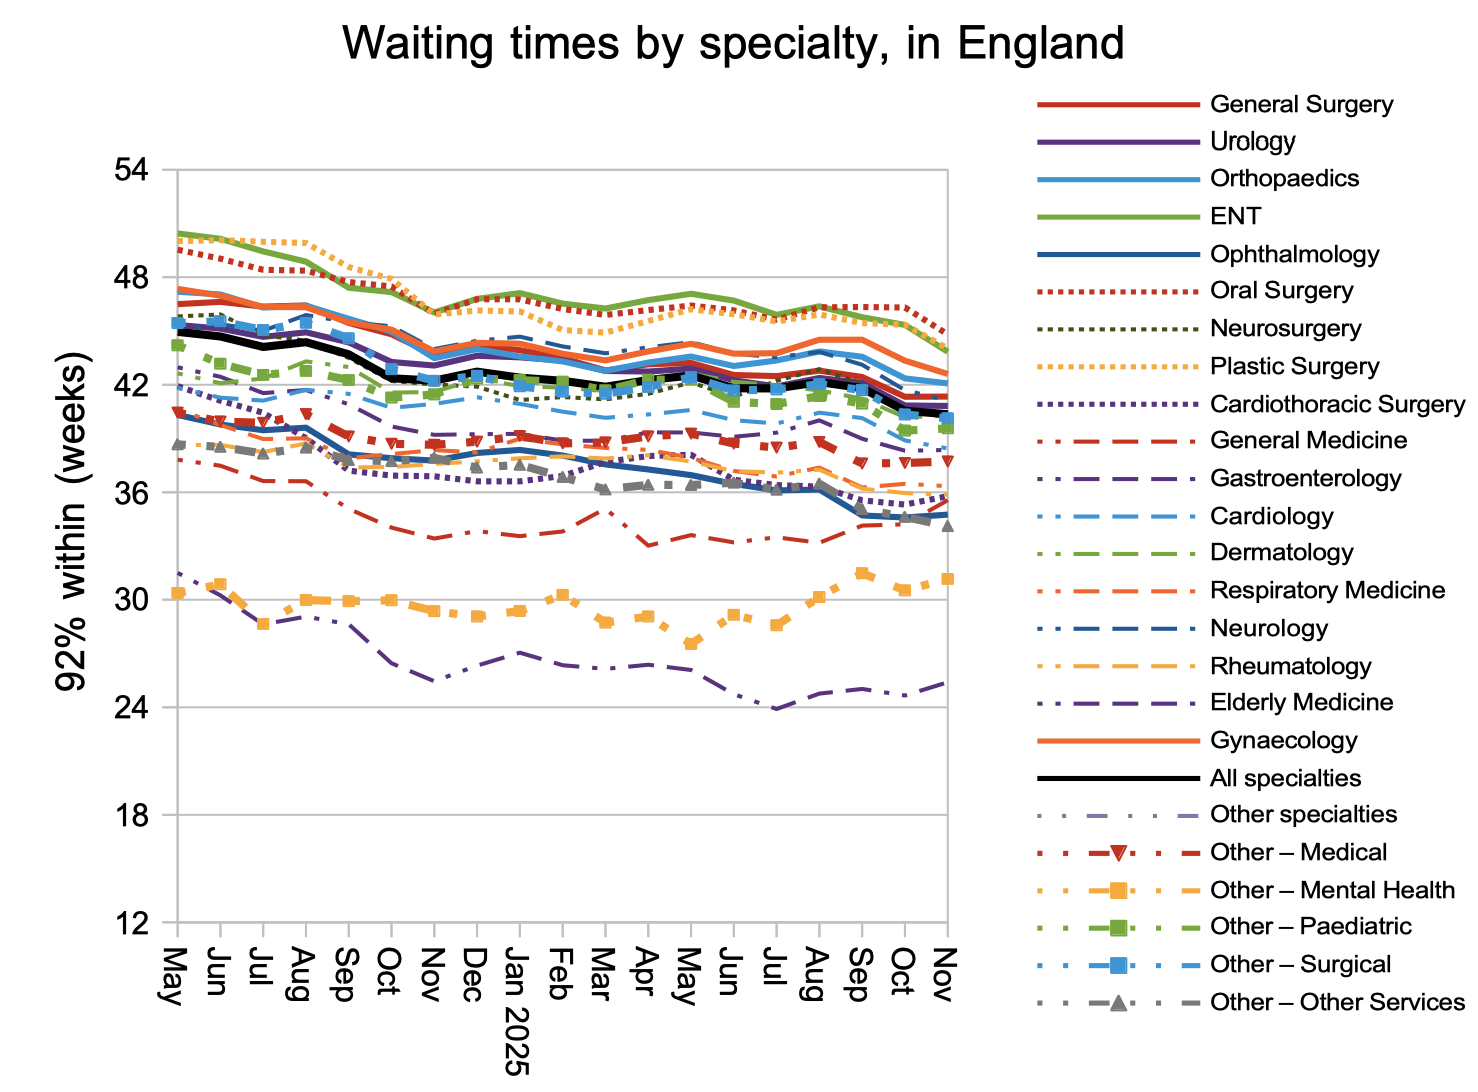
Waiting times are a function of both the size and shape of the waiting list, and the next chart is a measure of the shape. The recovery trajectory (which we were looking at in the first chart above) assumes that the shape will improve towards 2013-16 levels. This should occur naturally as the waiting list falls. If it doesn’t, then even larger waiting list reductions would be needed to restore 18 week waits.

The biggest reductions in waiting times were seen in the longest-waiting specialties: Oral Surgery, Plastic Surgery, and ENT.
The waiting list shrank because patients were treated, discharged, and removed administratively from the RTT waiting list faster than they were added to it. Usually I present charts showing how those measures compare with recent years (with the exception of administrative removals, for which data is not published). However this month I won’t, because my data does not adjust for non-reporting trusts. NHS England’s statisticians do a better job, providing suitably adjusted data in Charts 2-4 of the official Statistical Press Notice.
Referral-to-treatment data up to the end of December is due out at 9:30am on Thursday 12th February.