English waiting list peaking just below 3 million
23/09/2013by Rob Findlay
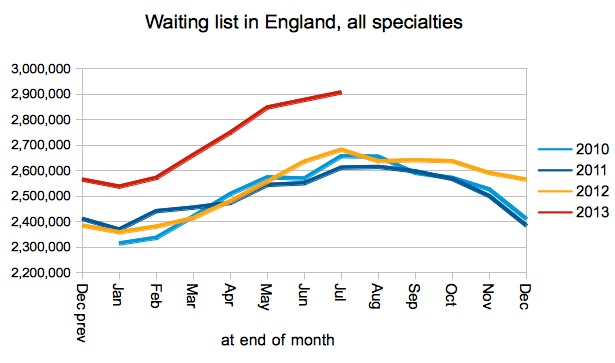
The English waiting list is near its seasonal peak for the year, with 2,906,537 patients waiting at the end of July. That’s big. It’s the biggest reported waiting list since April 2008, back in the days when 31% of the waiting list had waited over 18 weeks, and 8% of the list had waited over a year. And a bigger list means bigger pressures on waiting times.
In spite of this, the main “18 weeks” target is holding steady, and even Orthopaedics is now solidly achieving it. It is disappointing that one-year-waiters are not falling steadily towards zero, but they aren’t seriously deteriorating either.
Can this success on long-waits be sustained when winter pressures start interrupting the scheduling of elective patients? Maybe, maybe not. We will have to wait and see. But commissioners and providers should be concerned about the size of their waiting lists. In practical terms, they should do what they can to stop waiting lists from getting even larger in the coming months, and cap list sizes in their plans for next financial year.
In the following analysis, all figures come from NHS England. If you have a national statistic that you’d like to check up on, you can download our Gooroo NHS waiting times fact checker.
England-wide picture
The as-reported waiting list should be at or near the seasonal peak, just shy of 3 million (as I estimated a couple of months ago).
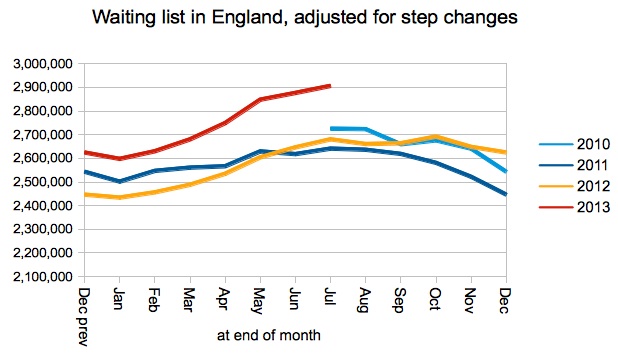
The English NHS is improving its ability to count all patients who are waiting, and if the national waiting list is adjusted for step-changes in local list sizes then the waiting list still looks very large but the growth is less dramatic.
I plan to retire this adjusted data series now, because it’s really fiddly to maintain. The point has been made, I hope, that the larger list is unlikely to be entirely an artefact of more-effective counting.
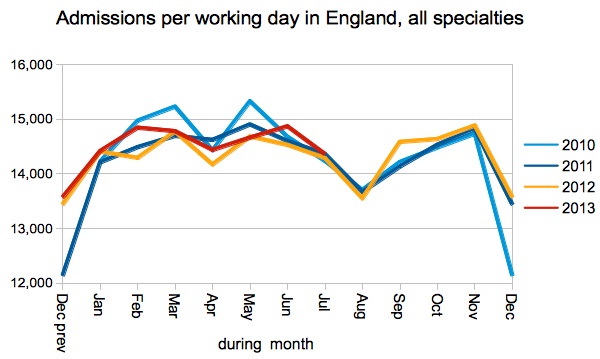
Admissions are exactly in line with recent years.
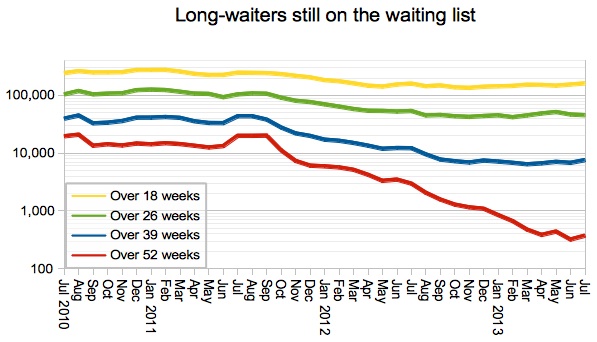
The improvement in one-year-waits has slowed and is now wobbling. Come on, folks, we’re nearly there! One last heave. These ultra-long-waiters are a stain on the NHS’s reputation.
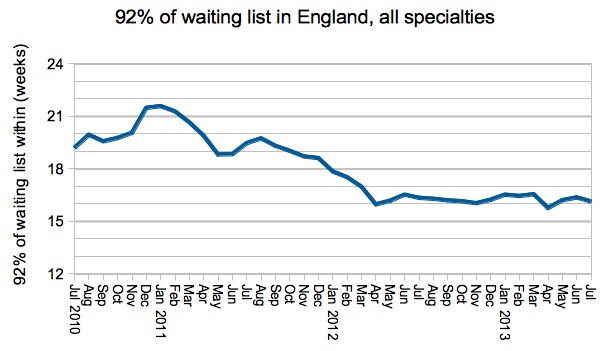
The position on 18 week waits remains steady, despite the big waiting list.
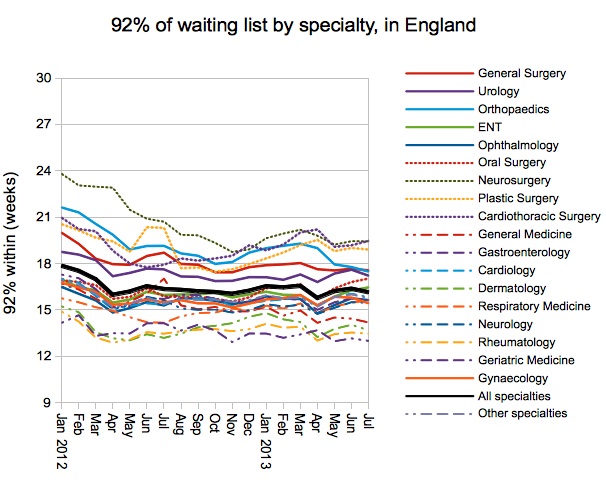
It is good to see Orthopaedics plunging ever-more confidently into “18-weeks success” territory.
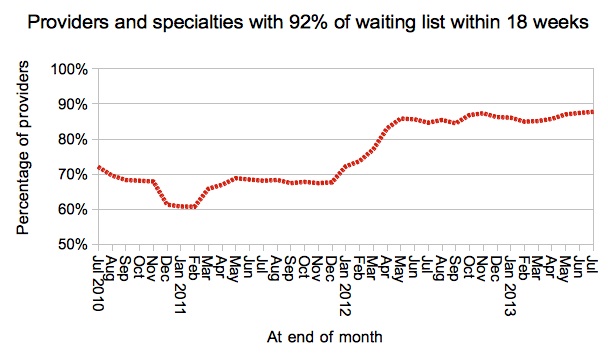
The proportion of local services achieving the incomplete pathways (waiting list) target remains steady.
Provider top ten
The Trusts with the largest number of one-year-waiters were: Barnet & Chase Farm 108, The Whittington 41, Barts 26, East Kent 25, King’s 24, and RJAH 19.
This month’s “top ten” longest-waiting providers is:

Two Trusts get special mentions this month.
Firstly, congratulations to Basildon and Thurrock University Hospitals NHS Foundation Trust for getting their 92nd centile incomplete pathways waits down from 19.1 to 16.9 weeks, which means they have dropped out of the table from 8th place to 45th.
Secondly, congratulations to the RJAH. They’ve been at first or second position in the table since early 2012 (when they started reporting their ultra-long-waiters correctly). Now, suddenly, they have nearly managed to drop off the table altogether. They had hoped to achieve all their targets in orthopaedics by the end of July, and although they didn’t quite succeed they have made great progress and I look forward to seeing that result appear in the coming months.
The August 2013 data is due out at 9:30am on Thursday 17 October 2013.
Return to Post Index