Unexpected rise in August waiting list
21/10/2013by Rob Findlay
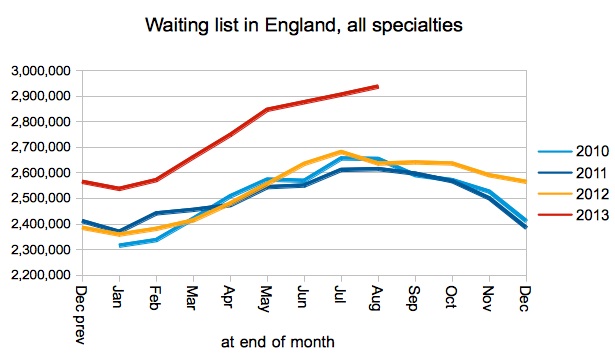
The English waiting list grew sharply in August; the biggest (and only significant) August increase since 2008. Not only is the waiting list now bigger than at any time since April 2008, but the gap has widened again compared with recent years and the pressure is on to sustain the 18 week targets over the coming winter.
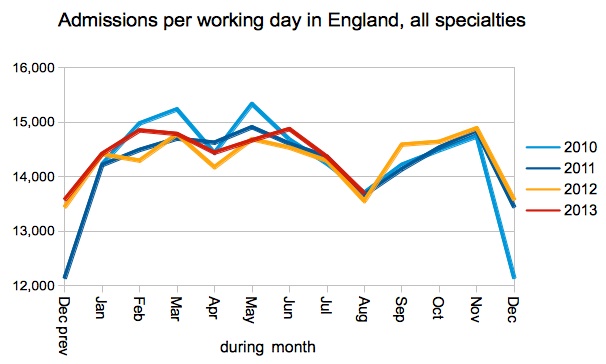
Admissions per working day were exactly in line with recent years, and it is worrying that the NHS is failing to keep up with rising referrals.
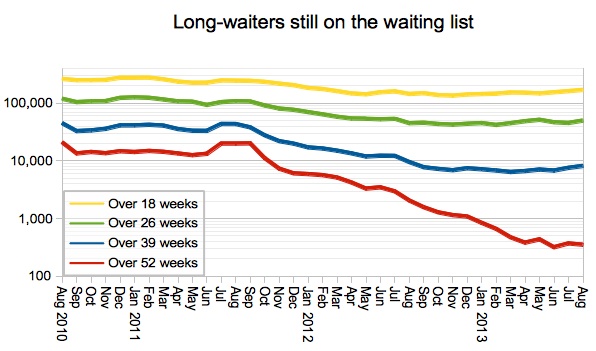
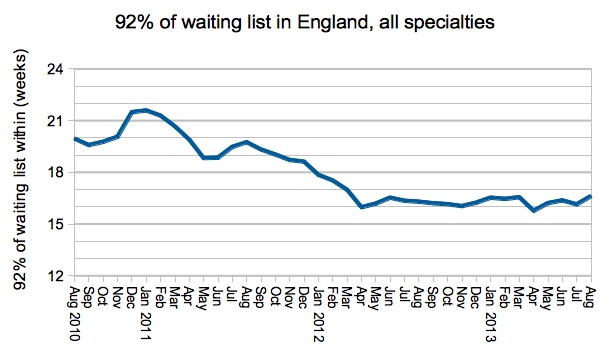
The position on 18-week and 52-week waiters remained broadly steady. The main 18-week target was met comfortably at national level. One-year-waits, though failing against the ‘zero tolerance’ target, sustained their recent dramatic improvements (352 one-year-waiters at the end of August, compared with 2,054 the year before).
In the following analysis, all figures come from NHS England. If you have a national statistic that you’d like to check up on, you can download our Gooroo NHS waiting times fact checker.
England-wide picture
The waiting list usually peaks in July or August, and it is unusual for the waiting to grow so much during the August holidays. The August growth this year was 31,348, compared with -45,370 last year (i.e. a dramatic fall), 3,092 in 2011 (a slight rise), -1,798 in 2010 (slight fall), -21,354 in 2009 (substantial fall), and 34,089 in 2008 (the last sharp rise).
All NHS organisations would do well to monitor their list sizes frequently and regularly. Quite simply: if your list is growing unexpectedly then you have a problem.
Over the next few months we need to see the size of the national waiting list coming down significantly, as it did in 2010 and 2011. If it’s flatter, as it was last year, then we could really be in trouble over the winter.
Admissions remain exactly in line with recent years, and this is a problem because referrals have gone up. In the long run, the NHS can do no more (and no less) than keep up with demand, and currently it is not.
Ultra-long waiters are still wobbling, with some Trusts clearing their one-year waiters and others popping up with backlogs. This is about priorities, not money, so let’s treat them and have a good cheer when one-year-waits are ended once and for all.
The position on 18 week waits remains steady. (Or is that little uptick the first sign of slippage?)
Orthopaedics achieved the target again, but its success looks to be short-lived.
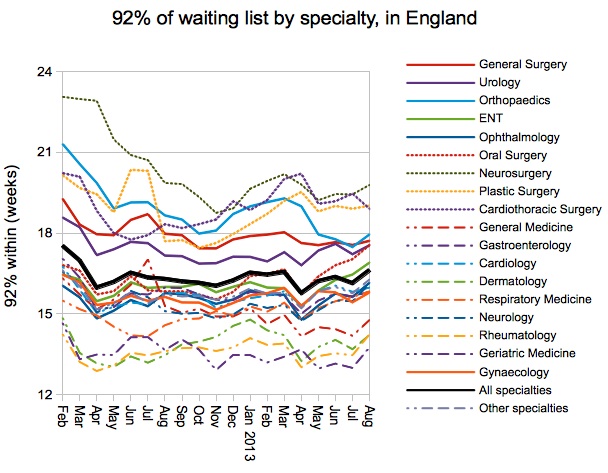
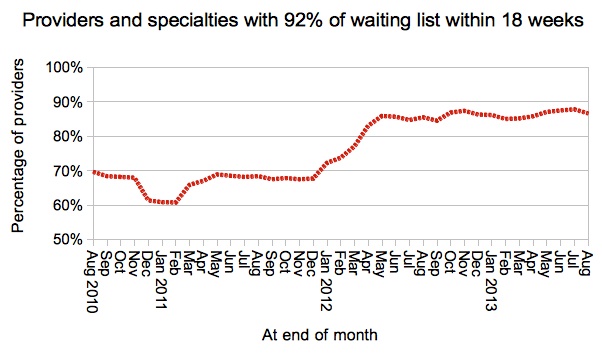
The proportion of specialties achieving the main target at provider level remains steady.
Provider top ten
Only 44 NHS Trusts and 8 independent sector providers have any one-year waiters at all. Those with the most are Barnet and Chase Farm (108), King’s (28), Shrewsbury and Telford (25), East Kent (23), Heart of England (22), and The Whittington (22).
This month’s ‘top ten’ providers with the longest waiting times (excluding small providers with fewer than 1,000 on the waiting list) are:

Congratulations to the The Robert Jones and Agnes Hunt Orthopaedic Hospital NHS Foundation Trust, whose very long name I thankfully will not need to type again. They used to have “District and Orthopaedic” in there too, so they have tried to shorten it. Now they’ve shortened their waiting lists as well and dropped off the ‘top ten’ entirely, having been near the top since they discovered their waiting times problem early last year. It is very good to see that they are now achieving all their targets.
Congratulations also to North Bristol and Buckinghamshire for dropping off the table, in a worthwhile though less-dramatic fashion.
The September 2013 data is due out at 9:30am on Thursday 14 November 2013.
Return to Post Index