
18 weeks breached again as waiting list grows
19/04/2016by Rob Findlay
The English NHS breached the 18-week waiting times target again at the end of February, with only 91.7 per cent of patients waiting less than 18 weeks since referral (against a target of at least 92 per cent). Those are the figures if you add in the last known positions at non-reporting Trusts. On the officially-reported figures the target was narrowly achieved at 92.1 per cent.
The year-on-year deterioration in the waiting list worsened. On the official figures, the total number of patients waiting grew 14.3 per cent, the number of over-18-week waiters was up 30 per cent, and the number of over-52-week waiters was up 55 per cent.
But there is also something puzzling about this latest data. Waiting times improved slightly during February. And yet: the waiting list grew, admissions per working day were down on recent years, and the NHS devoted a smaller proportion of its capacity to treating long waiters than in the previous month… all of which should push waiting times up.
On the other hand, non-admitted clock stops were 5 per cent higher year-on-year and reached a new February record, so perhaps that explains the improvement in waiting times. An increase in non-admitted clock stops could mean that more patients were treated in outpatients. But it could also mean an increase in clinical discharges, “active monitoring”, decisions not to treat, and removals from the list after the patient Did Not Attend an appointment, all of which could be the result of a stricter application of the rules rather than an enhanced service to patients.
There is also the possibility that waiting list validation efforts have been stepped up, which would reduce the number of longer waiters without affecting the other statistics. So forgive me for not raising an unequivocal cheer for this small improvement in waiting times, but it is not clear from the data that the underlying waiting time problem is really being solved.
England-wide picture
Let’s deal with non-reporting Trusts first. The list of non-reporting Trusts was the same as January, and if you add them back into the reported figures then the 18-week target was breached at 91.7 per cent.
All the figures from here onwards will be based on the reported data only.
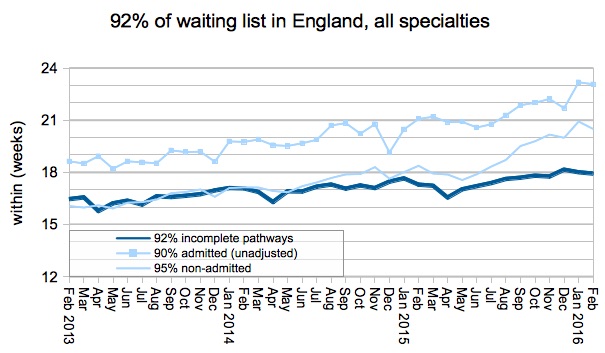
Waiting times improved slightly (dark line), and this is mysterious because so many factors suggest that they should have deteriorated. Firstly, the proportion of capacity devoted to treating long-waiters fell (pale lines).
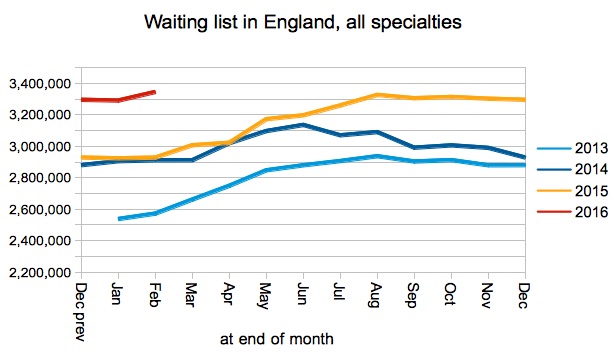
Secondly, the waiting list grew.
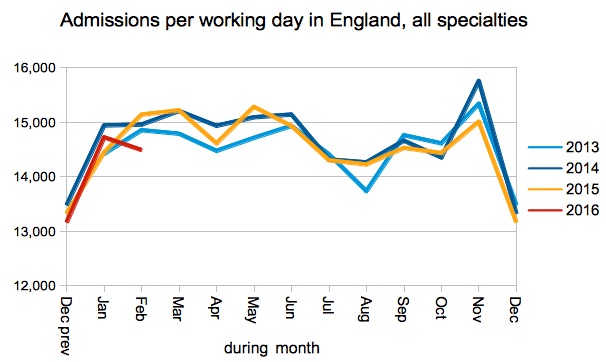
Thirdly, admissions per working day fell.
I don’t usually track the non-admitted numbers because I suspect they can be somewhat misleading. One reason is that they include ‘non-treatment’ clock stops such as the start of active monitoring, and removal following Did Not Attend (DNA). The other is that when you look at the data for individual hospital specialties there are often very large spikes in non-admitted clock stops that bear no relationship to what is happening on the waiting list.
On this occasion, however, we have a little mystery to clear up and it is possible that non-admitted clock stops might hold the key. Non-admitted clock stops per working day were 2,300 higher than in the previous February, which is more than enough to offset the dip in admissions shown in the previous chart. So this could explain the fall in waiting times, but unfortunately we can’t tell whether it reflects genuine patient treatments or clocks being stopped for other reasons.
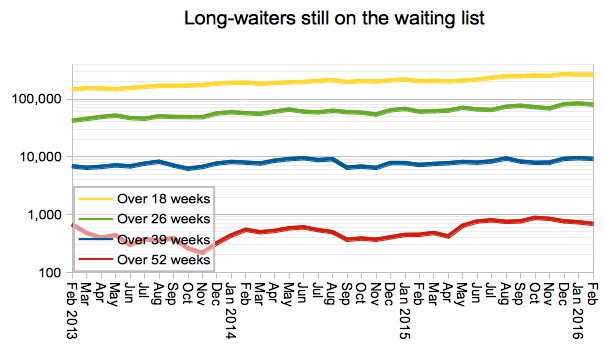
Long-waiters have been improved recently (for those Trusts who are reporting data), but even so the number of one-year-waiters stood at 683 compared with only 442 the previous February.
Among the surgical specialties only Ophthalmology and Gynaecology achieved 18 weeks. Among the medical specialties Gastroenterology returned to 18-weeks compliance.
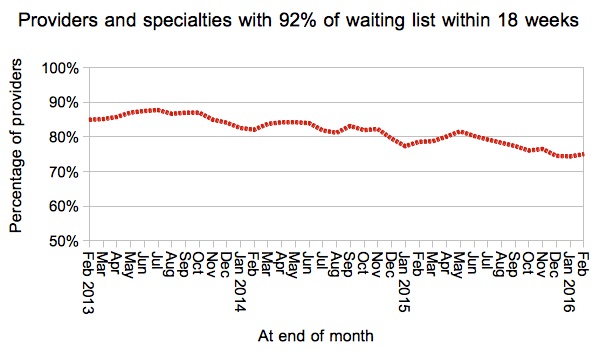
The proportion of local provider-specialties achieving 18 weeks improved very slightly from 74.4 to 75.0 per cent.
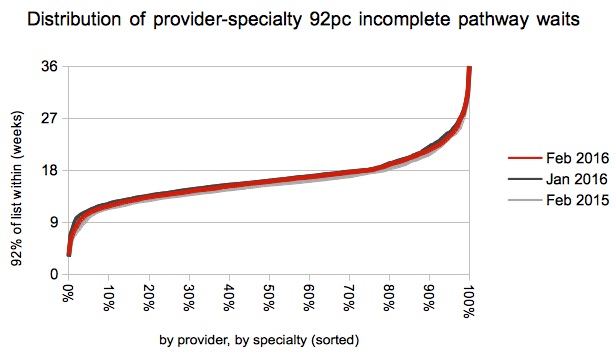
And the distribution of waiting times across local specialties was hardly changed during the month, although there was an across-the-board deterioration year-on-year.
Local detail
We’ve done some interactive maps showing the waiting times position by specialty for every Trust and CCG with significant numbers of admissions. If you want to look your own Trust up quickly, then visit our 18-weeks reports page.
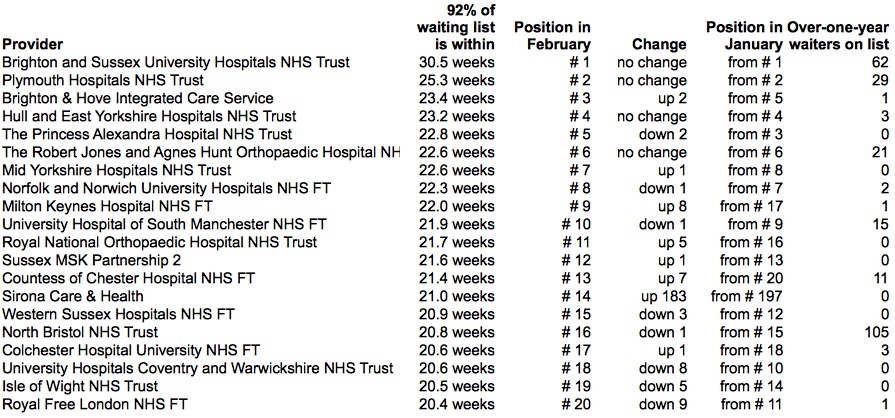
Brighton and Sussex University Hospitals NHS Trust topped the table again, and their 92nd centile waiting times lengthened from 29.9 to 30.5 weeks.
North Bristol continued to improve their position in the ranking, and have made serious and welcome inroads into their one-year waiters which are down from 141 to 105.
Data for March 2016 is due out at 9:30am on 12th May 2016. There is a possibility that the English NHS might start achieving the 18 week target again (with non-reporting Trusts factored in), but I suspect that growing capacity pressures and the effect of strikes could push the post-winter recovery back to April.
Return to Post Index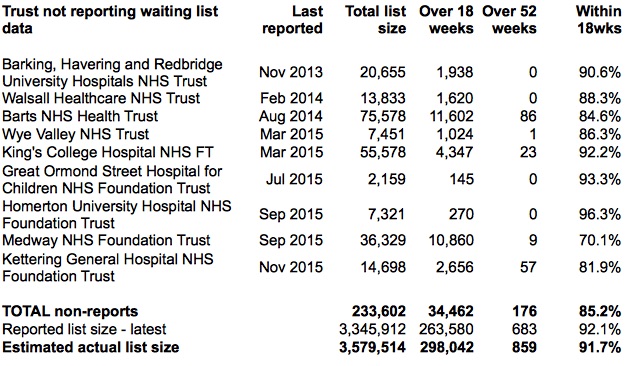

Leave a Reply
You must be logged in to post a comment.