Modelling to achieve targets throughout the future period
21/04/2016by Rob Findlay
When we demonstrate Gooroo Planner, and show people how it achieves your waiting list and waiting time targets at the end of the future period, people often ask: “can it achieve the targets throughout the future period as well?”.
Our answer used to be: “No, because if the waiting list is far too big at the start, then all the backlog clearance would need to be done in the first week, which is unrealistic”.
But now we have a different answer. It is: “Yes”.
And oddly enough the solution was right there in our explanation for “no”: if the waiting list at the start is the problem, then that is what you need to change. Then, with that settled, you can work out how to get there.
Happily this matches the real-life problem that operational managers are often set. Something like: “You have until October to clear the backlog. After that, no more breaches of the target will be tolerated.”
So step one is to work out what your waiting lists need to be like in October, on the basis that you will consistently achieve the targets every week thereafter. Step two is to work out your capacity plan for the backlog clearance between now and then. And Gooroo Planner is now fully equipped to work it all out for you.
Update: if you prefer video to text, then a video that walks through the process is available here
How to do it
Here is the new control in the calculation settings – the second control below. It’s already there and ready to use as a free upgrade:
This control is available with every future activity scenario, except for “Match waiting list targets” because achieving the targets throughout the period would conflict with having to achieve them precisely at the end.
So what does this new control do, exactly? It changes the size of the waiting list at the start of the future period, so that your waiting list and waiting time targets are achieved throughout the future period, but without the waiting list becoming negative at any point. If it is impossible to achieve both, then it will just make sure that the waiting list bottoms out at zero and never becomes negative.
Some examples
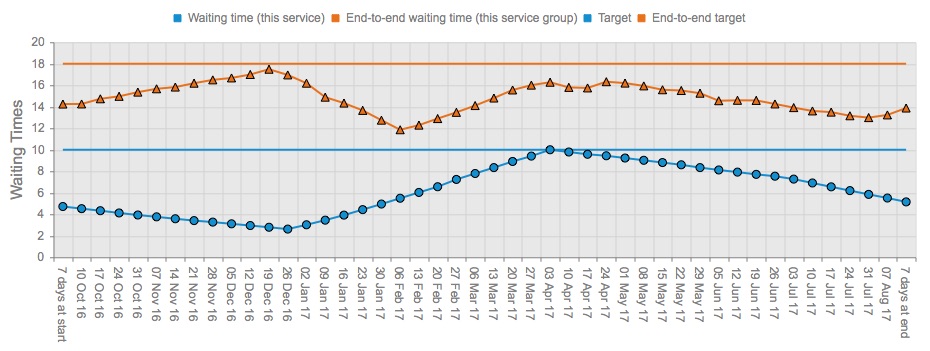
If waiting times are the main goal, then you’ll get a result like the chart below (when you look at the service in the Profiling tab). Look at the blue lines. The line with blobs on it shows the waiting times profile for this clinical service, and the straight line shows the target waiting time; as always, both lines are on whatever basis you chose, e.g. 92% of the waiting list snapshot, or 90% of treated patients.
In this plan, the longest waiting times are expected at the end of the week beginning 3rd April 2017, and Gooroo Planner has planned for them to peak exactly on target. It achieved this by changing the waiting list at the start of the future period, and as you can see the waiting list had to start off quite small to make it work.
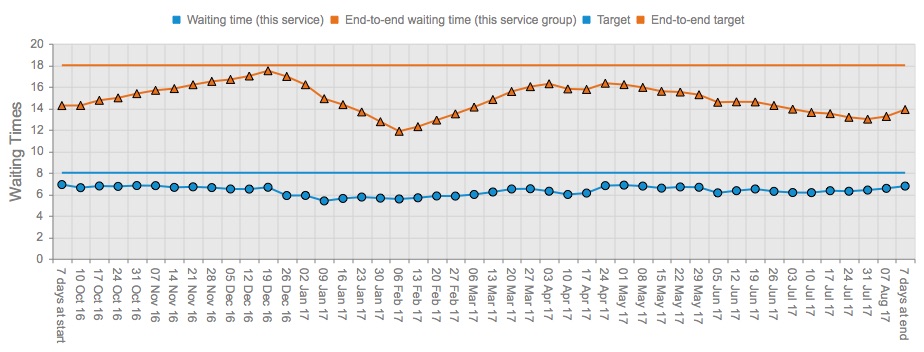
The next chart shows a service where the waiting list has been capped at a particular size, and where that is a tougher constraint than the waiting times target. At its largest, the waiting list peaks exactly on target, while the waiting times shown on the chart remain below their target throughout.
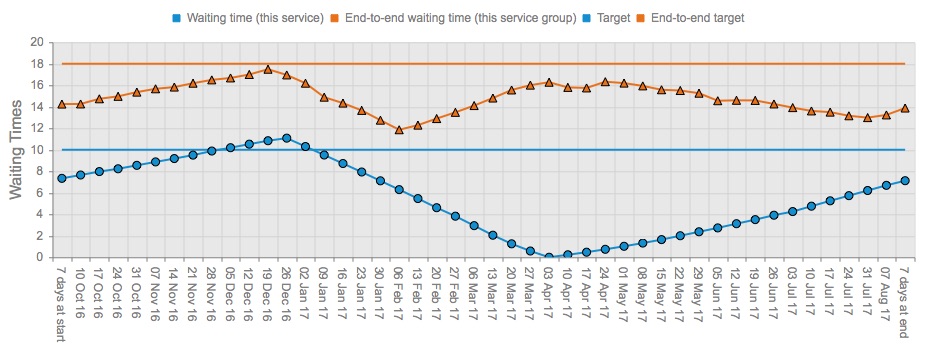
Sometimes it isn’t possible to achieve the targets throughout the future period without the waiting list becoming negative at some point, which would make sense in maths but makes no sense in real life. So when this happens the model will ensure that the waiting list never becomes negative, even though the consequence is that the target will breach at some point during the future period.
In the chart below, Gooroo Planner has made sure that the waiting list bottoms out at zero but never becomes negative, but the consequence is that waiting times are expected to pop over target around Christmas.
(If you want to eliminate the breaches as well, then you will have to change the activity profile through the period so that waiting times don’t vary so much. Or you could comfort yourself with the observation that referral-to-treatment waiting times, shown by the orange lines, remain within target.)
Rolling the model backward
Having worked out the waiting list you need to achieve at the start of the future period, you then need to work out how to achieve that. So we’ve provided a new “Roll backward” feature in the report manager’s “Convert to dataset” wizard:
This wizard turns your previous report into a new dataset, and this new “roll backward” option does four further things:
- It rolls the future period backward, so that the new model runs from the end of the past period up to the start of the previous model.
- It takes the waiting list size that we needed to achieve at the start of the previous model, and makes that the target waiting list size for our new model.
- It changes the future activity scenario to “Match waiting list targets”, so that activity and capacity will be set to achieve this list size target.
- Finally, it makes sure that the list size at the start of the new future period is sensible – i.e. that it matches the list size at the end of the past period.
If you now create a report based on this new dataset, it will work out the activity and capacity you need to achieve the list sizes that we worked out above.
Via the Planner API
Achieving the target throughout is also available via the Planner API. Just add <SetTgtThroughout>2</SetTgtThroughout> to the Report section of your Goorooconfig.xml file. If you don’t want to achieve the target throughout then you can omit this line or change it to <SetTgtThroughout>1</SetTgtThroughout>. This is also explained in the current documentation for Gooroo Planner.
As always, if you have any questions about any aspect of Gooroo Planner, please email support@gooroo.co.uk and we will be delighted to help.
Return to Post Index


Leave a Reply
You must be logged in to post a comment.