
RTT admission rates collapse
14/03/2018by Rob Findlay
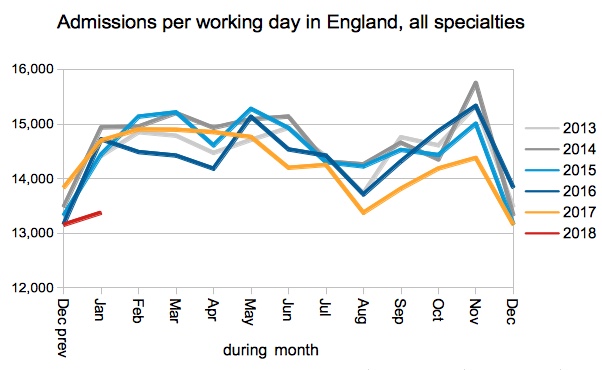
Did the central edict to stop non-urgent care in January show up in the statistics at all? It certainly did. At just 13,400 admissions per working day, it was not only the lowest January figure on record, it was the first January to fall below 14,000 since 2008.
Why? In a word: beds.
Emergencies take first call on beds, especially when A&E access is top of the agenda. Next come cancer and other urgent patients. Routine electives come last, which is why they were lined up for “deferral” when the beds filled up. The order of priorities is correct as far as it goes, but if the NHS cannot keep up with demand for all kinds of care, including routine elective care, then the waiting time pressures will carry on growing.
For analysis of waiting times performance at a particular organisation, visit our reports page. You can also access maps of the latest waiting times across England for A&E, cancer, and RTT.
In the following discussion, all figures come from NHS England. If you have a national statistic that you’d like to check up on, you can download our RTT waiting times fact checker.
England-wide picture
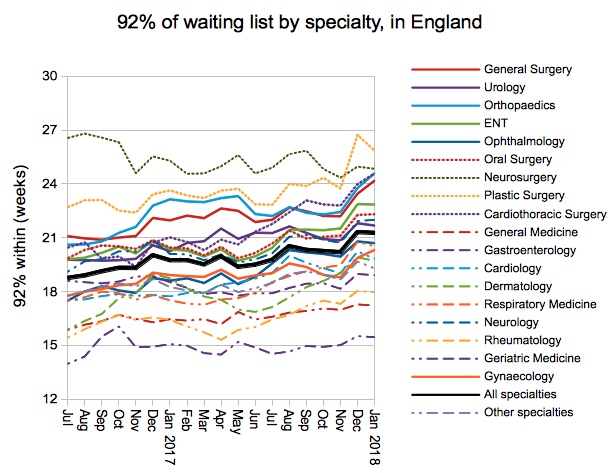
The sharp increase in waiting times seen in December was preserved through January.
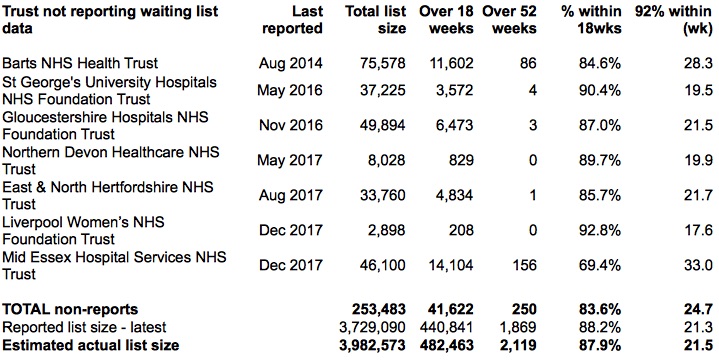
Turning briefly to non-reporting trusts, congratulations are due to Bradford Teaching Hospitals NHS Foundation Trust for successfully returning to RTT reporting. However Liverpool Women’s NHS Foundation Trust have dropped out, and Mid Essex Hospital Services NHS Trust have dropped out again after a single month of reporting.
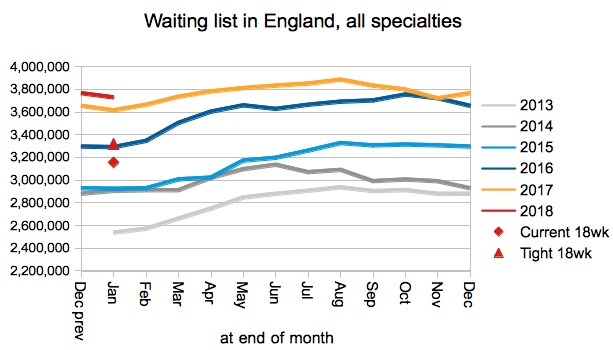
Returning to the officially reported figures, the waiting list shrank slightly in line with the usual seasonal pattern, despite the slowdown in admissions. On past form we would expect it to start rising again in February, and close in on the record of 4,187,398 patients which was set in the very first month of reported data back in August 2007.
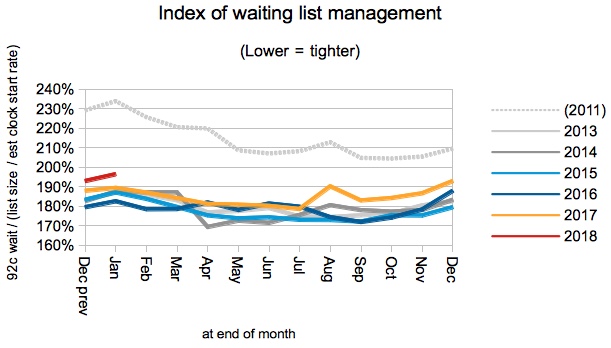
Waiting times are a function both of list size and the order in which patients are managed. The index of waiting list management remains looser than in recent years, which is adding to the current relatively long waiting times.
The next chart is the centre of attention this month. Admissions have been trailing for a while, but not like this. Admissions really stalled in January, and this vividly illustrates the shortfall in hospital bed capacity which makes it so difficult to absorb non-elective and elective demand.
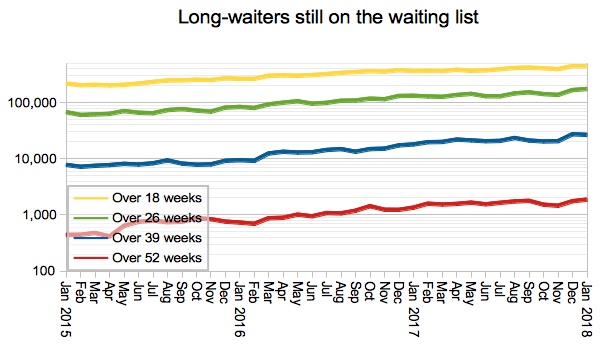
At the long waiting end of the list, one of the goals of the 2018-19 planning guidance is that “Numbers nationally of patients waiting more than 52 weeks for treatment should be halved by March 2019, and locally eliminated wherever possible.” so it is disappointing to see that one year waiters have risen again and (if non-reporting trusts are factored in) are back above 2,000 patients for the first time since 2012.
Waiting times shot up in Orthopaedics, General Surgery, Cardiothoracic Surgery and Gynaecology, with other specialties remaining roughly steady. The dip in Plastic Surgery will largely be the result of the major plastics centre at Mid Essex Hospital Services NHS Trust dropping out of the data again.
Local detail
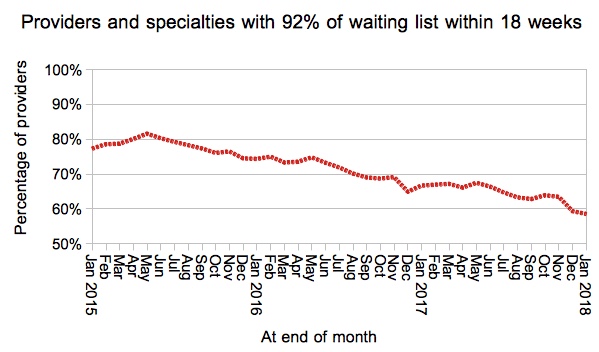
The proportion of local provider-specialties achieving 18 weeks edged downwards again slightly…
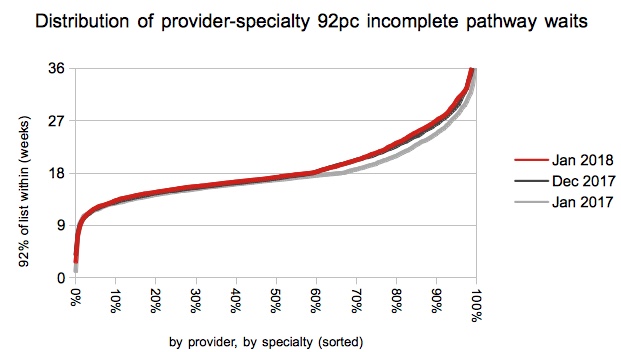
…as the distribution widened a bit further, as waiting times rose again at the longer-waiting end of the spectrum.
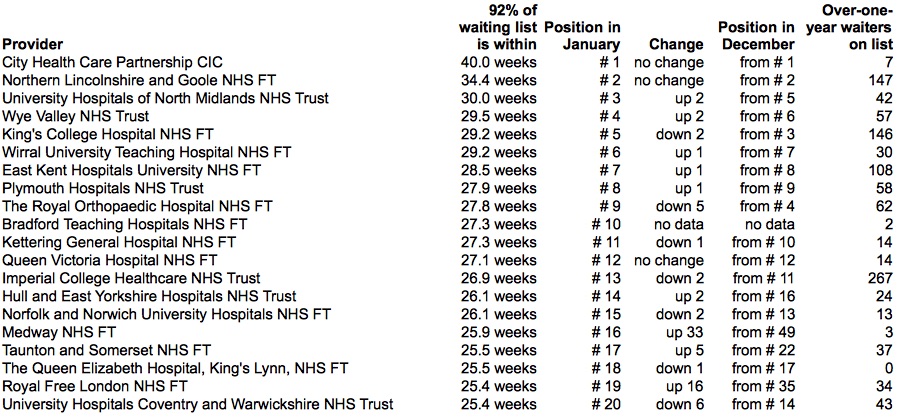
The surprise entry into the top twenty longest-waiting providers is Medway NHS Foundation Trust, whose 92nd centile waiting time rose from 21.9 weeks to 25.9 weeks during January – an increase of four weeks in a month. This is about as fast as it is possible to go, but the rise in waiting times was not accompanied by corresponding growth in the waiting list size; this could suggest that data quality or counting issues may be in play.
The release date for February’s data had not been announced at the time of writing, but it’s usually the second Thursday of the month which points to 9:30am on Thursday 12th April.
Return to Post Index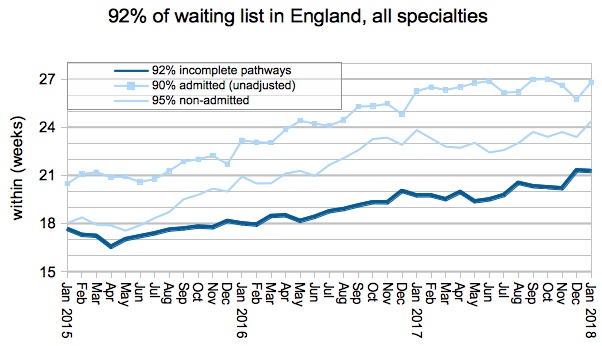
Leave a Reply
You must be logged in to post a comment.