
Elective waits settle into steady deterioration
20/10/2021by Rob Findlay
Referrals plummeted in the first covid shutdown, and recovered only slowly during the summer of 2020. When referrals drop, fewer patients are added to the elective waiting list, and we can still see those abnormally small cohorts in the longer-waiting reaches of the national waiting list today.
But only just. The first covid shutdown was so long ago now, that the lull in referrals has almost fed through and is barely visible.
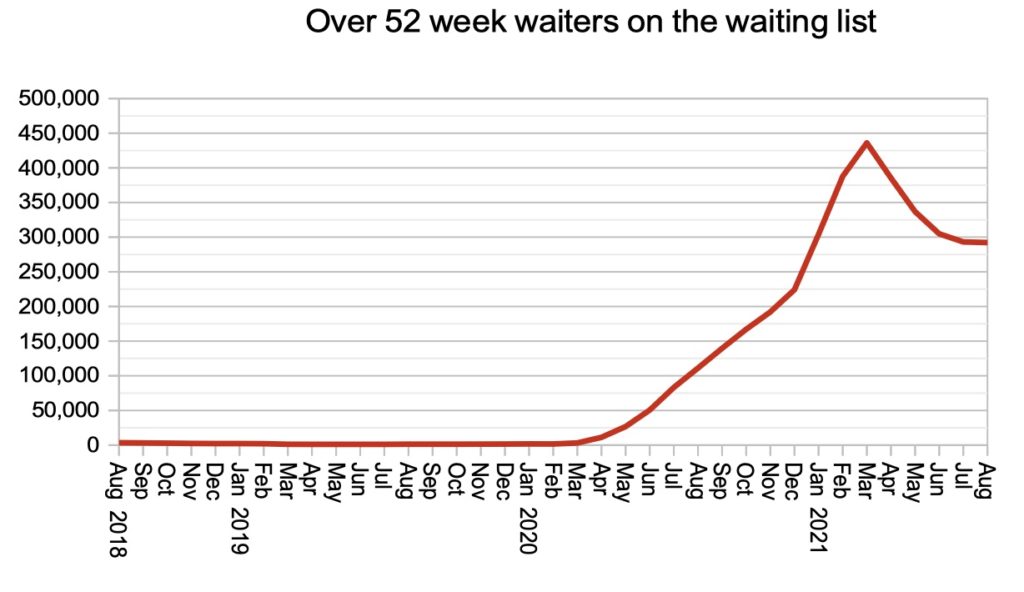
The other temporary consequences of the first covid shutdown are also fading away, in particular the dramatic rise and then fall in over-52-week waiters on the list.
Usually the NHS is able to preferentially treat clinical priorities and long-waiters, but the shutdown put a stop to routine surgery which meant that the longest waiters were left on the waiting list. So the number of over-52-week waiters rose sharply for a while.
Then treatment resumed and the NHS was able to start treating long-waiting patients again. At the same time, those abnormally small cohorts from the first covid shutdown were reaching their anniversary on the waiting list, which meant that far fewer patients were tipping over the 52-week mark. So from April this year, the number of one year waiters fell sharply.
This temporary effect is also coming to an end, and the underlying trends that have become established over the summer are now dominating all the figures.
The waiting list is growing steadily as the NHS remains unable to keep up with elective demand. The temporary rise and fall in waiting times caused by the extraordinary first covid shutdown has fed through the list, and waiting times are now established on an upward trend powered by the rise in underlying pressures.
The deterioration will continue until the NHS is able to keep up with elective demand, which it has not done for nearly a decade.
In the following discussion, all figures come from NHS England and NHS Improvement. If you have a national statistic that you’d like to check up on, you can download our waiting times fact checker.
For analysis of waiting times performance at a particular organisation, visit our reports page, or our map of the latest RTT waiting times across England.
The numbers
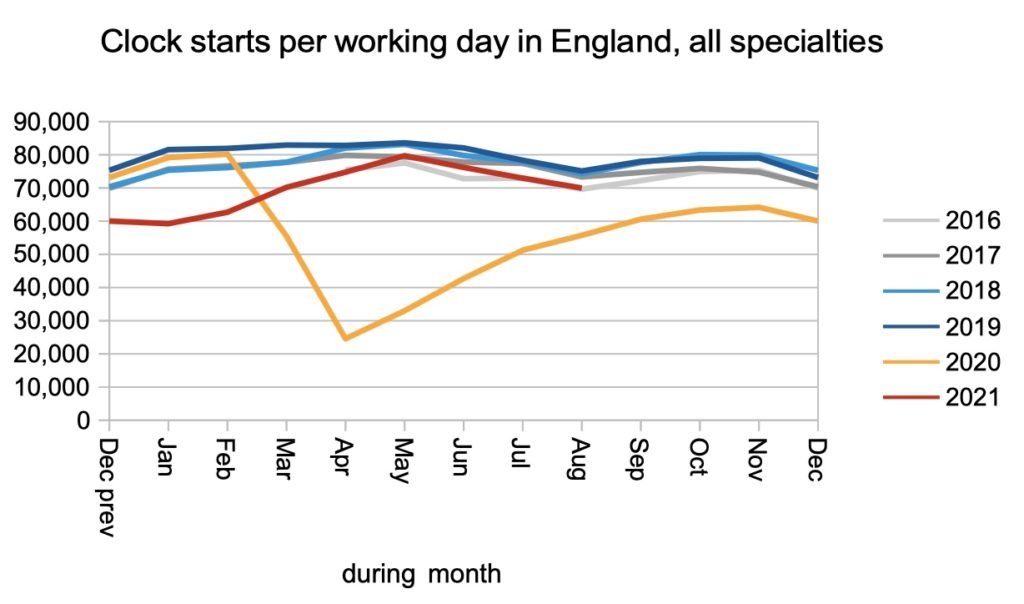
The referral rate (and therefore the rate that patients join the waiting list with new waiting time ‘clocks’) remained close to pre-covid levels in August, following the pattern established since May.
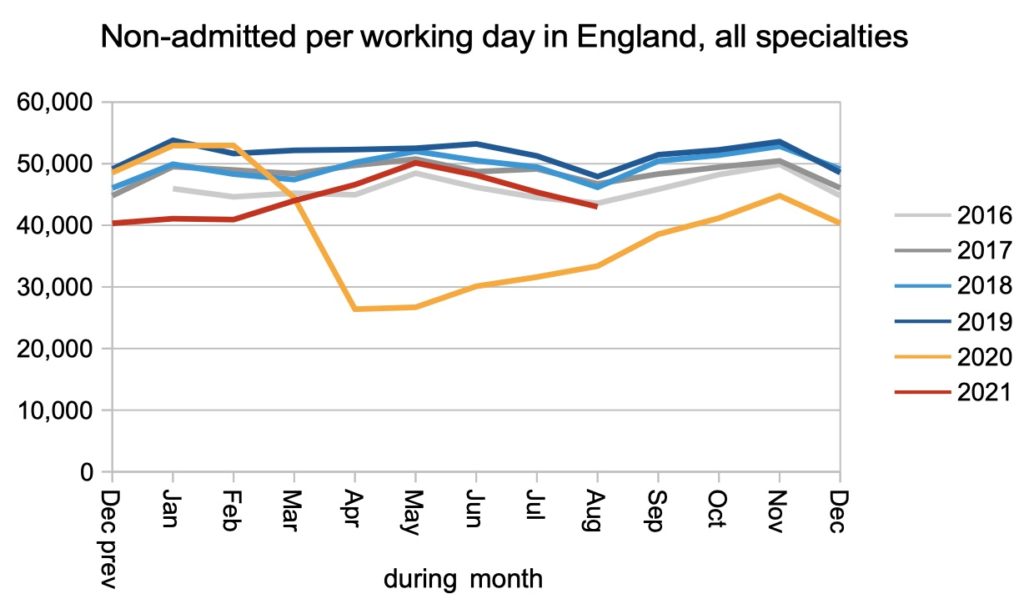
So did the rate of non-admitted clock stops (patients discharged from clinic, or removed from the waiting list for administrative reasons).
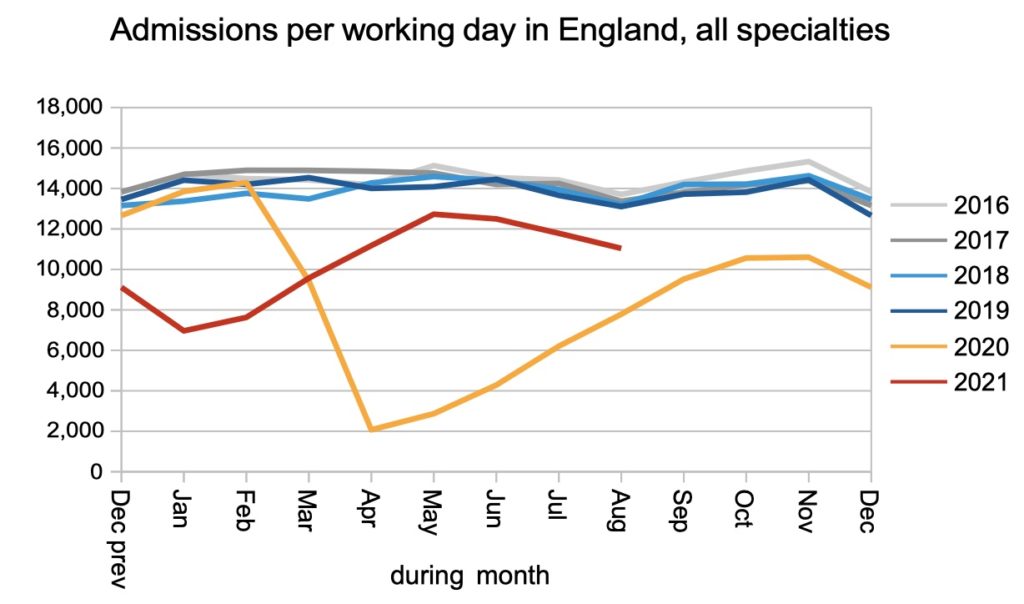
The admission rate remained significantly below pre-covid levels, again following the pattern established since May, as covid infection prevention and control measures continued to restrict the NHS’s ability to admit patients to hospital.
The rate that patients join and leave the waiting list has followed the same pattern since May, so it is unsurprising that the waiting list has been growing at about the same rate since May.
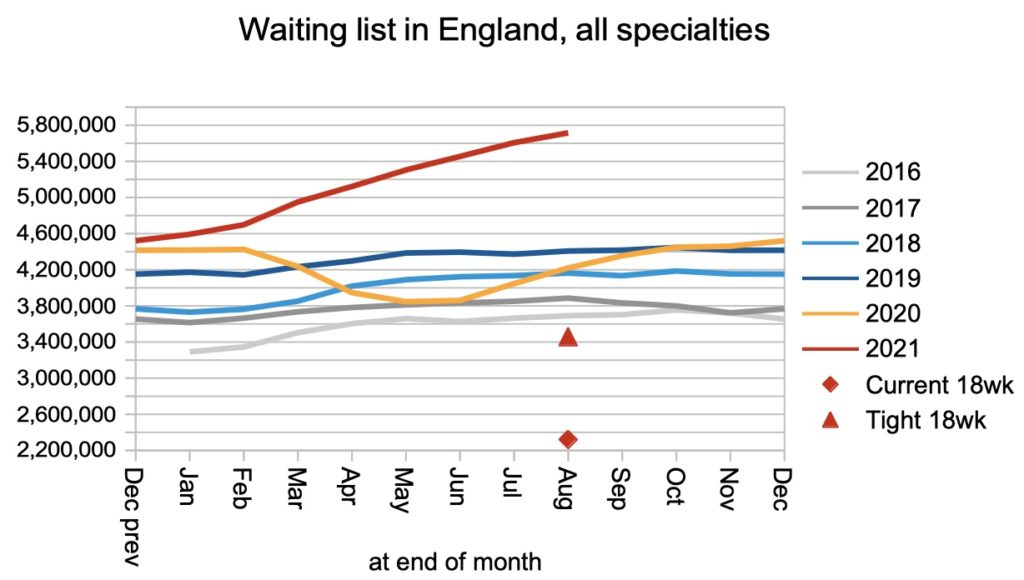
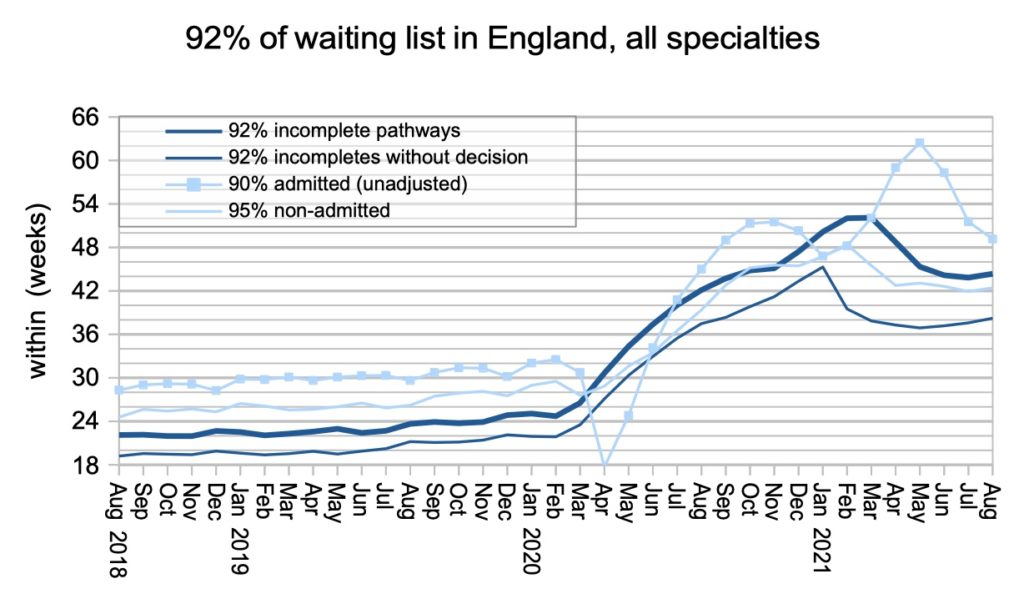
Waiting times rose and then fell as the temporary effects of the first covid shutdown fed through the end of the waiting list. Now waiting times have settled back into a pattern of growth, powered by the growing waiting list.
The number of over-52-week waiters also rose and fell, but that fall has now stopped. I would comment that it is usually not helpful to draw a line at any particular waiting time (whether 18 or 52 or 104 weeks) and then track the number or proportion who are above that threshold; although the metric works when waiting times are near the threshold, it stops working when they deviate significantly from it. So it is generally better to track waiting times: ’92 per cent of the list is within X weeks’, instead of ‘X per cent of the list is within 52 weeks’, because the former style of metric works for all waiting times.
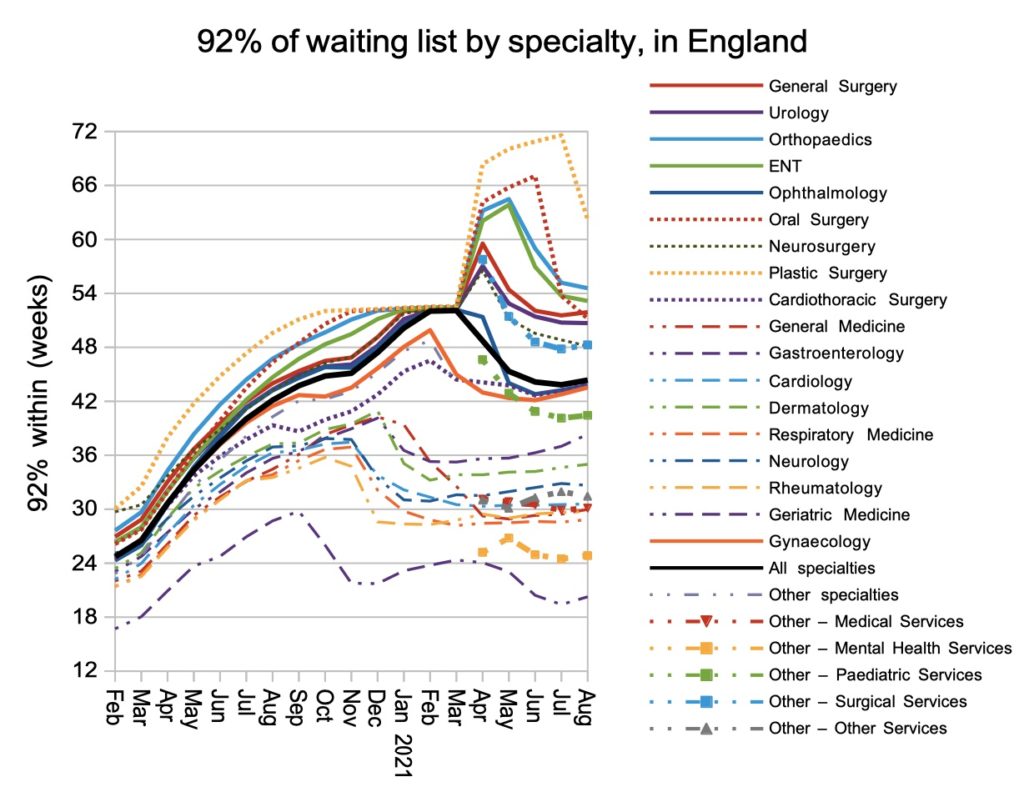
The temporary effects of the first covid shutdown are especially visible in the specialty-level data, but here too the underlying trend is emerging.
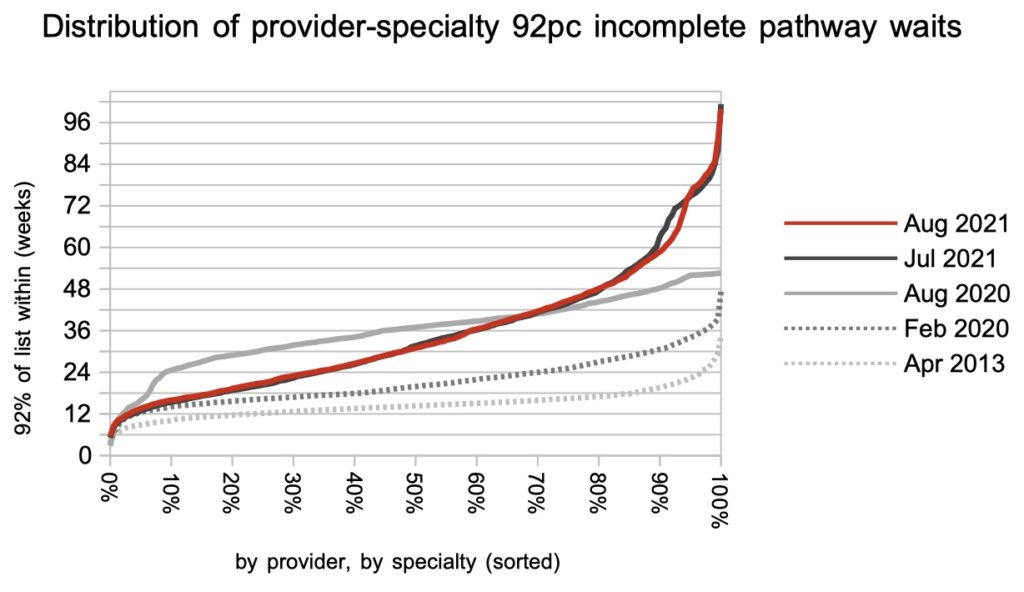
Looking at the distribution of the thousands of local waiting times, by specialty and by provider, the temporary effect of the first covid shutdown is narrowly visible towards the long-waiting end of the distribution while the rest has barely budged.
Referral-to-treatment data up to the end of September is due out at 9:30am on Thursday 11th November.
Return to Post Index
Leave a Reply
You must be logged in to post a comment.