
Neurosurgery waits surge as England’s elective list hits new high
19/10/2023by Rob Findlay
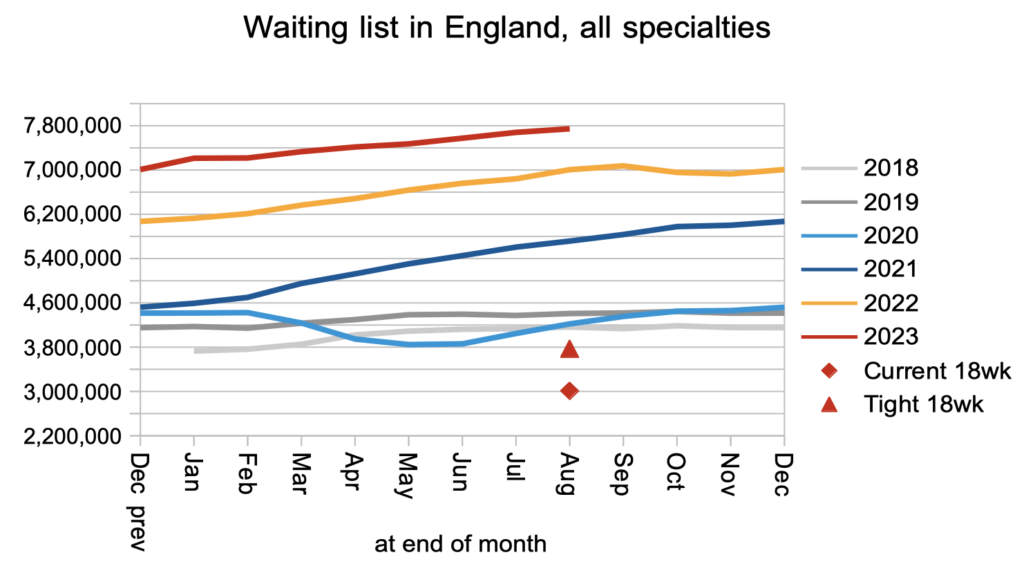
August’s referral-to-treatment (RTT) statistics followed a now-familiar pattern that looks set to continue. The English NHS did not keep up with demand, and the waiting list grew by 65,000 to a record 7.75 million patient pathways.
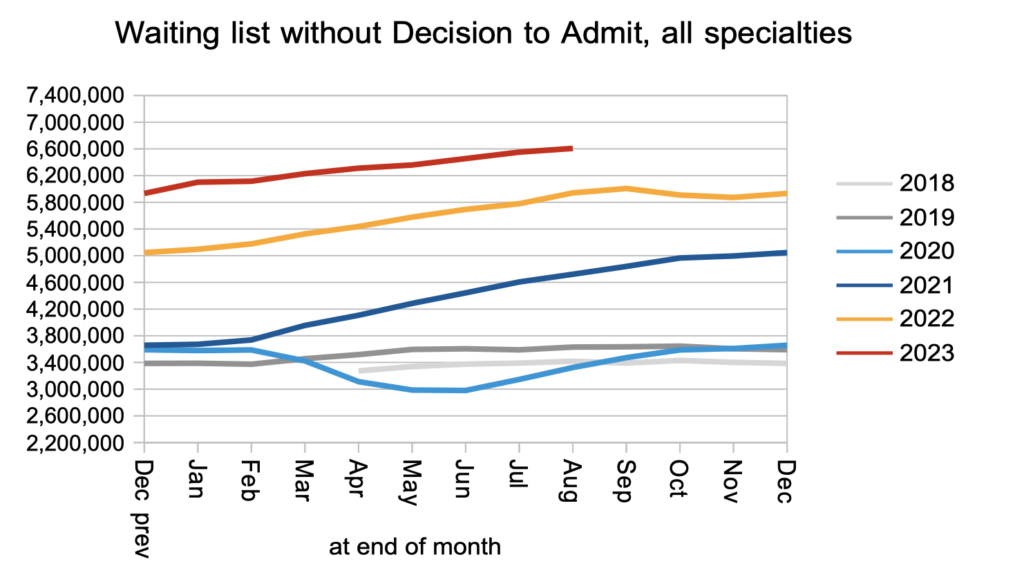
Most of them (some 6.6 million patient pathways) have not reached the point of diagnosis and decision to admit. Of those, an estimated 28,105 will unexpectedly discover that their diagnosis is cancer, after a typical wait of over 10 months. These figures represent real-life suffering and tragedy, and the risks are growing in proportion to the pre-diagnosis waiting list. It is only a matter of time before such cases start catching the public eye and widespread political attention.
In the following discussion, all figures come from NHS England. You can look up your trust and its prospects for achieving the current waiting time targets here.
The numbers
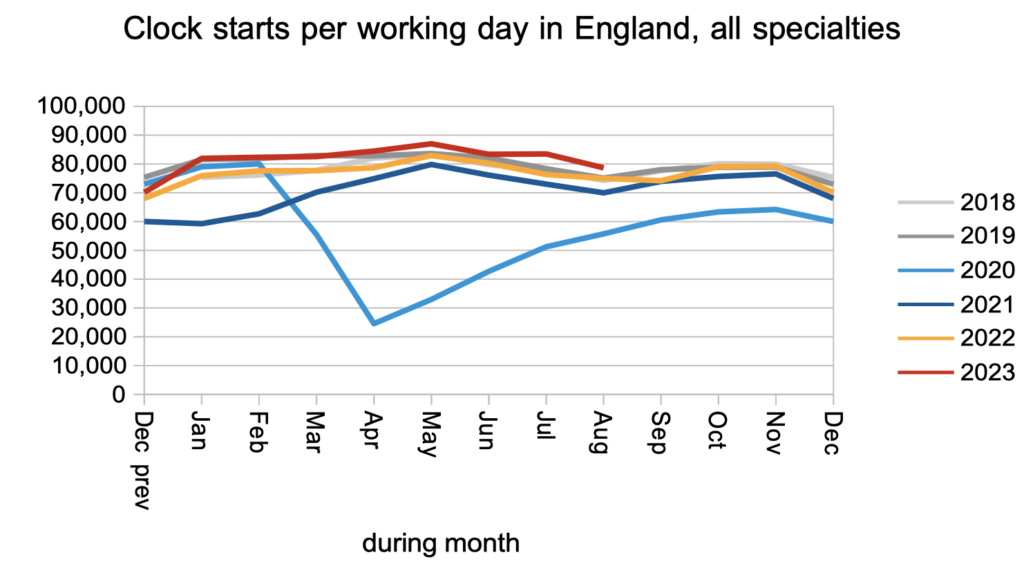
The number of patients starting new waiting time ‘clocks’ remained just above pre-pandemic levels in August. This is a measure of elective demand (though not necessarily an accurate one because the data is riddled with error).
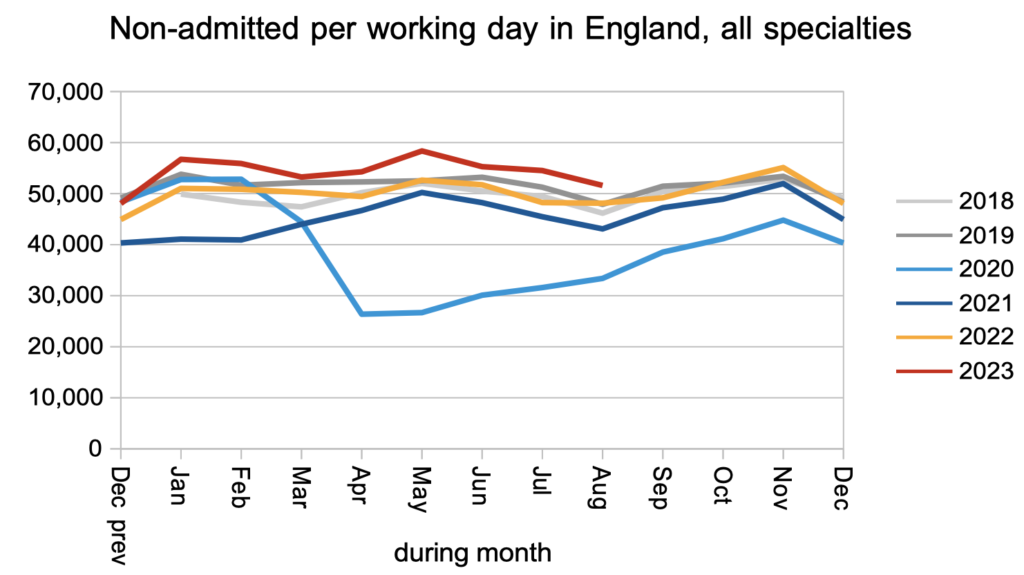
The number of patients leaving the waiting list without being admitted for treatment, mainly from outpatients or as administrative removals, also remained slightly above pre-pandemic levels.
As a consequence of the various joiners and leavers, the number on the waiting list without a diagnosis and decision grew by 56,100 to 6,607,521 patient pathways.
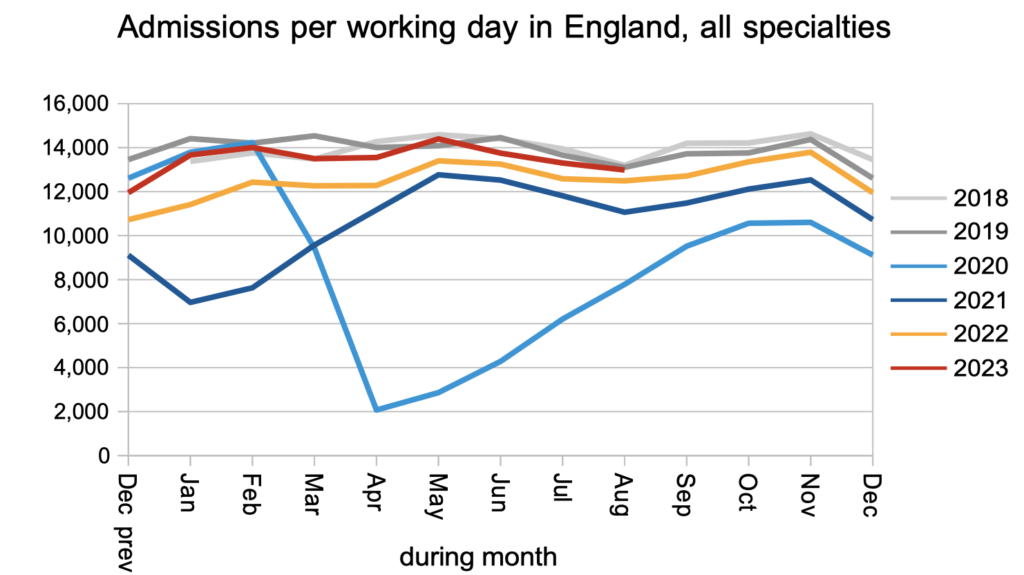
Patients were admitted for inpatient and daycase treatment at around pre-pandemic rates. These patients were, by definition, admitted from that part of the waiting list that had already received a diagnosis and decision to admit.
The consequence of all those clock starts, the admitted and non-admitted clock stops, and the 10-15 per cent of pathways that mysteriously disappear from the statistics every month, was that the waiting list grew to another new record. The Prime Minister has, of course, pledged that “NHS waiting lists will fall”.
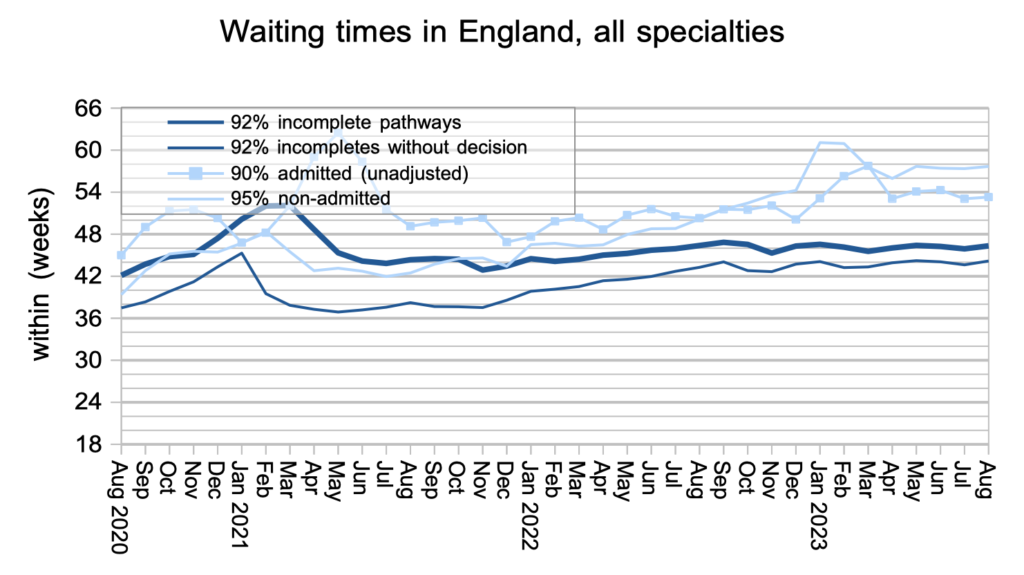
Waiting times remained very long, both up to diagnosis/decision and up to treatment, as they have since the pandemic. It is these long waiting times that really matter to patients, not the number of other patients on the list, although obviously the sheer size of the waiting list is a major cause of these long waiting times.
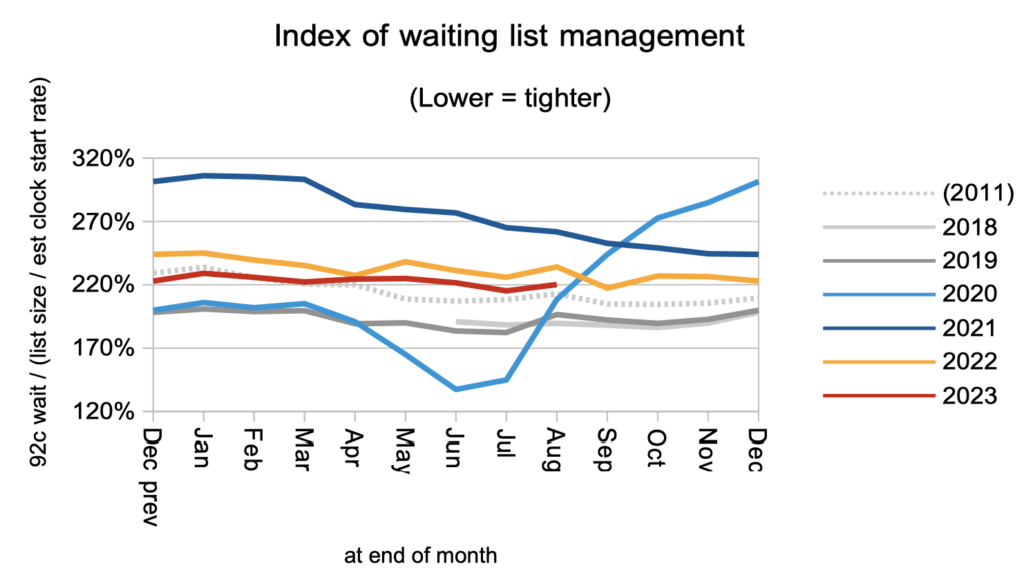
Waiting times are a function of both the size and shape of the list, and the shape is indicated by the index below. Within a local specialty or subspecialty, the shape of the waiting list is dominated by the order in which patients are booked; this should be driven mainly by clinical priority and time waited, but in practice this is not always adhered to. When many waiting lists are grouped together, as they are here at national level, the shape is mostly a reflection of some services having much greater waiting time pressures than others.
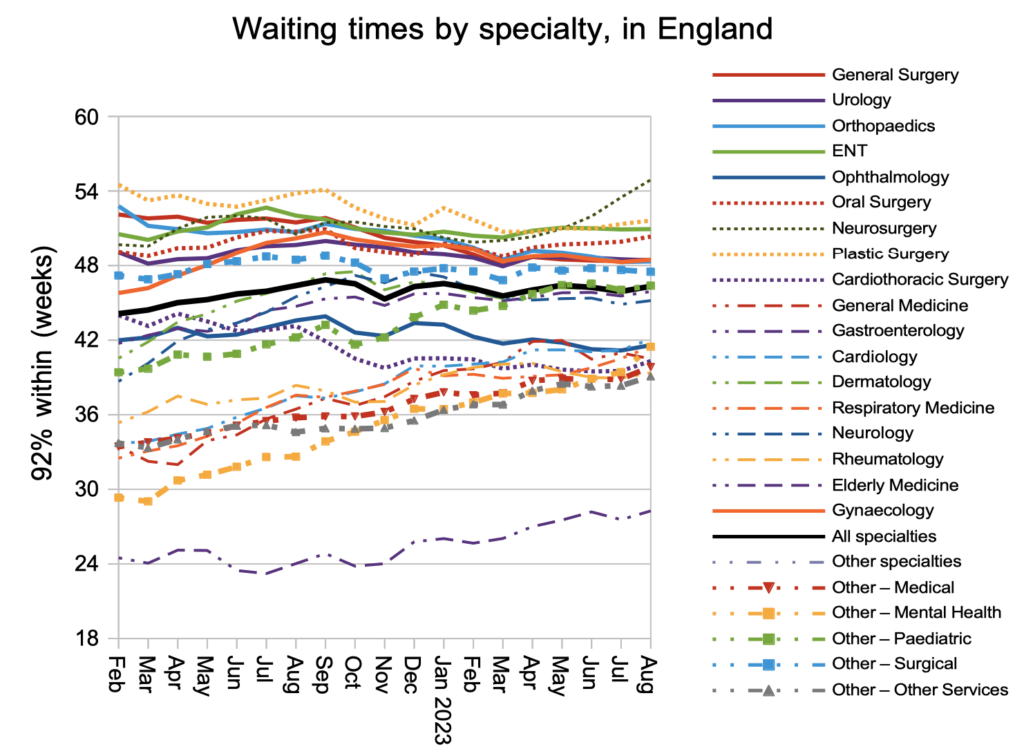
Looking at specialty level, neurosurgery has broken away from the pack in recent months with a particularly rapid rise in waiting times. The trust with the largest neurosurgery waiting list (and nearly half of the one year waiters) is the Northern Care Alliance NHS Foundation Trust, where the growing waiting time pressures look to be caused entirely by the sheer size of the waiting list (as opposed to any lack of good patient scheduling). Details like this matter because the current national waiting time targets cannot be achieved on average: they are only achieved when every service in every trust achieves them locally. You can look up the prospects for your trust’s specialties here.
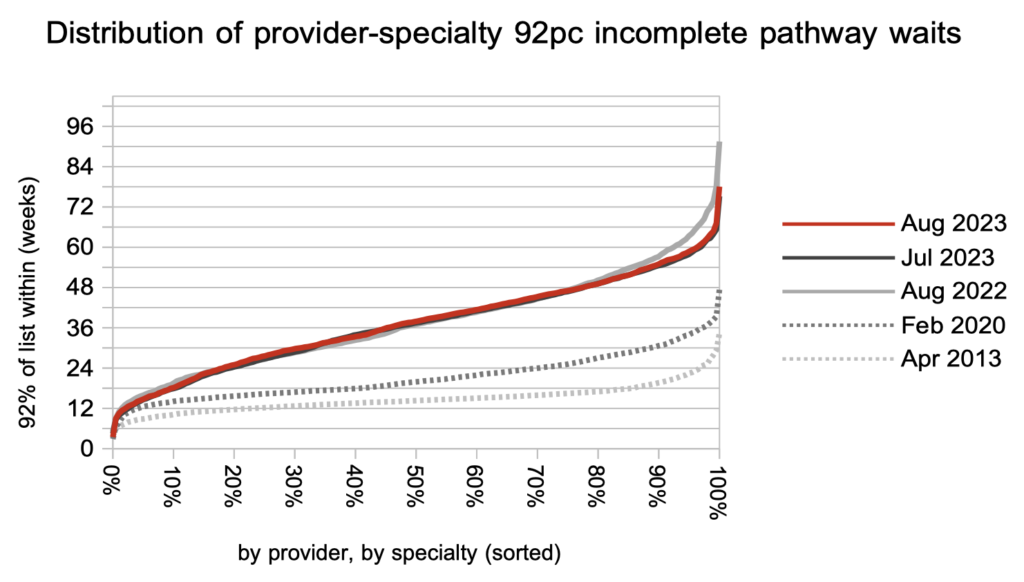
Looking at the distribution of waiting times, by trust and by specialty, they grew slightly across the board during August. Over the previous year, the only significant reductions in waiting times have been at the top of the scale in response to the targets. However the current targets are too blunt a policy instrument and the prospects remain poor for eliminating 65 week RTT waits by the end of March 2024 deadline.
Referral-to-treatment data up to the end of September is due out at 9:30am on Thursday 9th November.
Return to Post Index
Leave a Reply
You must be logged in to post a comment.