
Wait list (probably) flatlines as community services disappear from data
16/04/2024by Rob Findlay
The referral-to-treatment (RTT) waiting list data has now changed in two important ways.
Firstly, about 40,000 patient pathways in community services are now excluded from the RTT data collections, and this accounted for all of the apparent reduction in list size in the latest (February) official RTT data.
Secondly, NHS England have started regular publication of the more detailed and timely (though – for now – less complete and accurate) Waiting List Minimum Data Set (WLMDS).
Let’s look at those changes in more detail.
In early February, NHS England amended Section 7 of the the RTT reporting guidance to exclude all consultant-led community services from the national RTT statistics, even though those patients remain subject to RTT regulations. The change took effect immediately, and is reflected for the first time in this month’s main RTT data release.
On 27th February, NHS England issued an estimate that more than 40,000 patient pathways would disappear because they were coded under the Community Paediatrics Service. HSJ reported that over a thousand of them were 78-week breaches – some 10 per cent of the national total.
NHS England justified the change as allowing “for consolidated reporting of community services activity” (in the guidance), and “to eradicate reporting duplication” (in HSJ). However:
- This is a significant change to the RTT data collection, meaning that data from February 2024 onwards is not directly comparable with older data nor with prior government pledges to reduce waiting lists and waiting times. (To their credit, the NHS England statisticians have made this discontinuity very clear indeed in both the summary data table and the Statistical Press Notice.)
- Reporting duplication is normal for RTT data and there was no need to eradicate this instance of it – for instance, patients on cancer pathways are reported in both the cancer data and the RTT data (see Q.30 of the RTT FAQs).
- The Community Health Services Waiting Lists data does not identify how many pathways are consultant led, so it is not possible to reconstruct the full consultant-led RTT waiting list by adding data from the community and new-style RTT waiting list publications.
I find it difficult to avoid the conclusion that the main motivation for this change is to make the RTT figures look better than they really are, and I fear that the loss of scrutiny after these patients are confined to the lower-profile community services data will result in those patients waiting even longer and being put at increased clinical risk as a result.
On the plus side, it is good to see the start of regular publishing from the national Waiting List Minimum Data Set (WLMDS). There are sensible moves to see the patient-level WLMDS collection take over from the main RTT publication as soon as the coverage and quality are good enough, so we can look forward to having richer data that can focus on patient safety (including delayed urgent and ‘planned’ patients) and not just on the usual RTT waits.
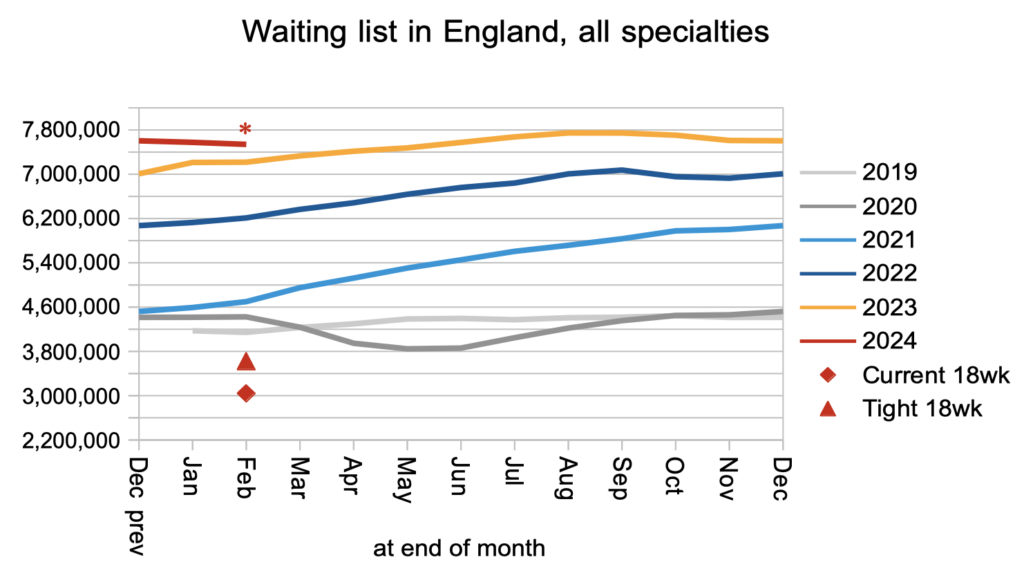
The disappearance of community services from the data means that it is difficult to draw firm conclusions about how RTT waits changed in February. According to the official Statistical Press Notice the apparent reduction in headline waiting list size is almost exactly accounted for by the disappearance of community services. So the waiting list probably flatlined in February, which is what you would expect seasonally for a national waiting list that is broadly stable (though at present, far too large).
It does look as though there was some improvement in the number of over 78 week waiters. Over 1,000 patients were expected to disappear with the community services, and they actually fell by about 4,000, so about 3,000 of the fall was probably genuine. That left some 9,969 non-community consultant-led RTT patient pathways waiting over 78 weeks – all of which were, of course, supposed to have been eliminated by April 2023.
In the following discussion, all figures come from NHS England. You can look up your trust and its prospects for achieving the current waiting time targets here.
The numbers
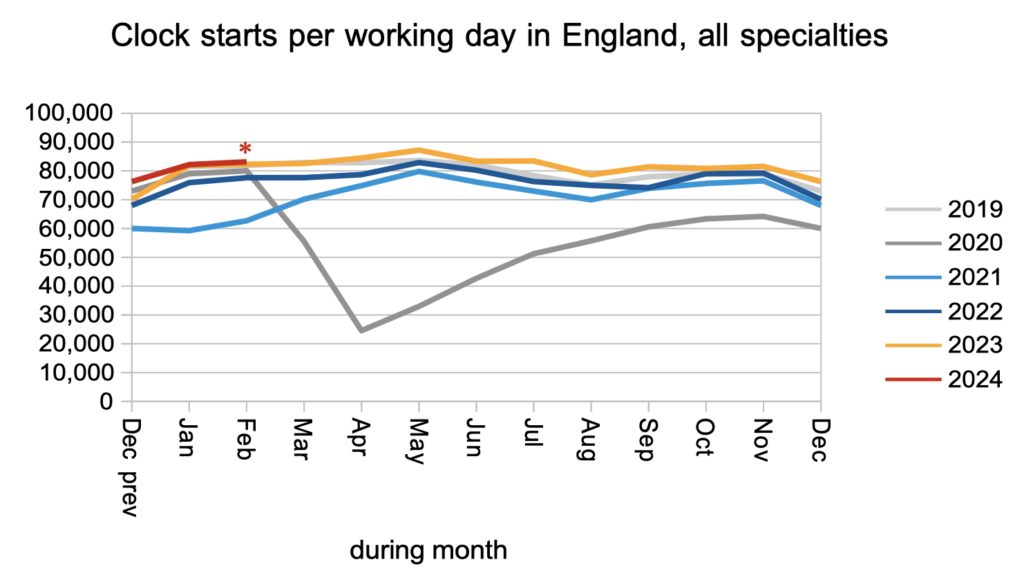
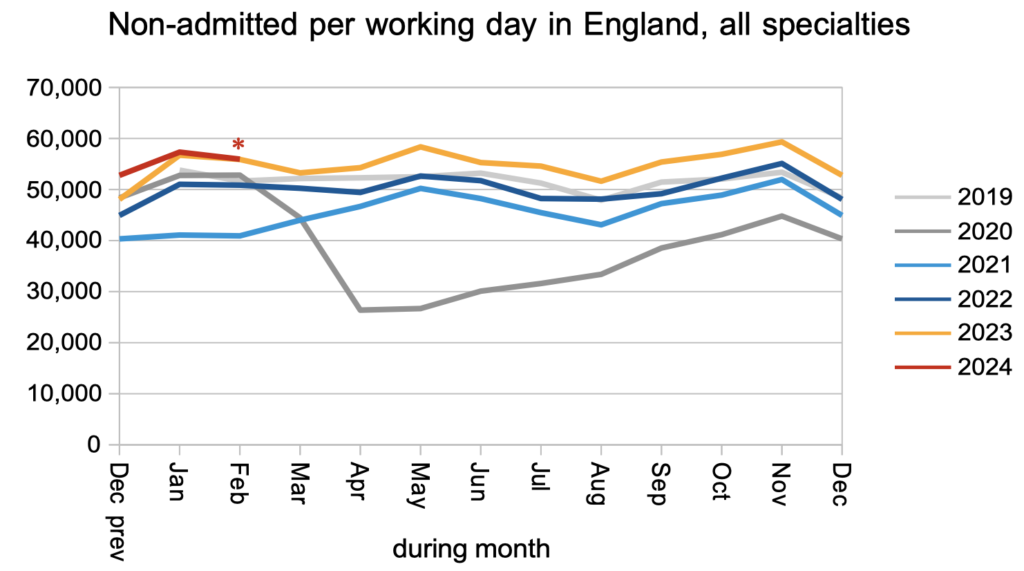
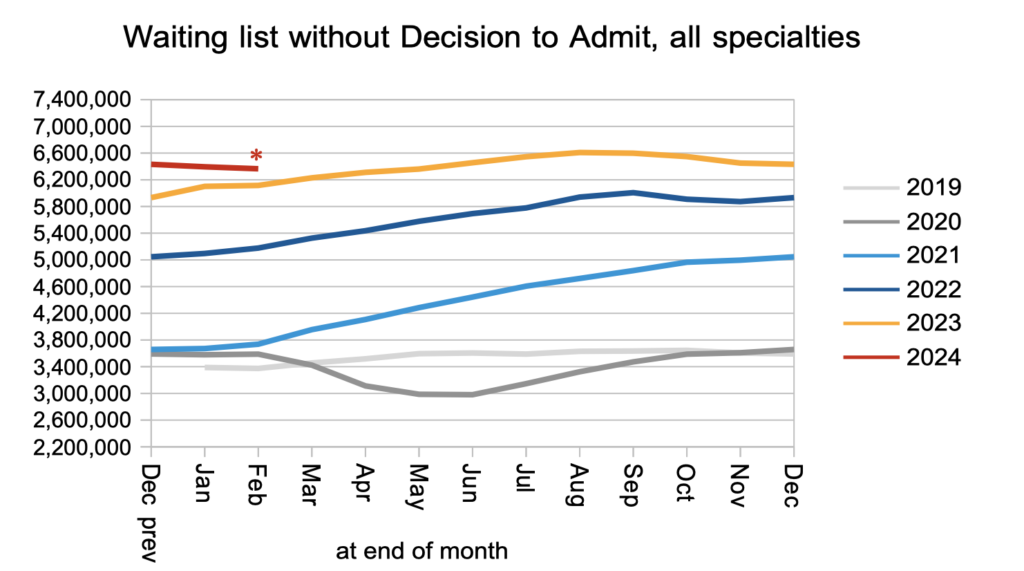
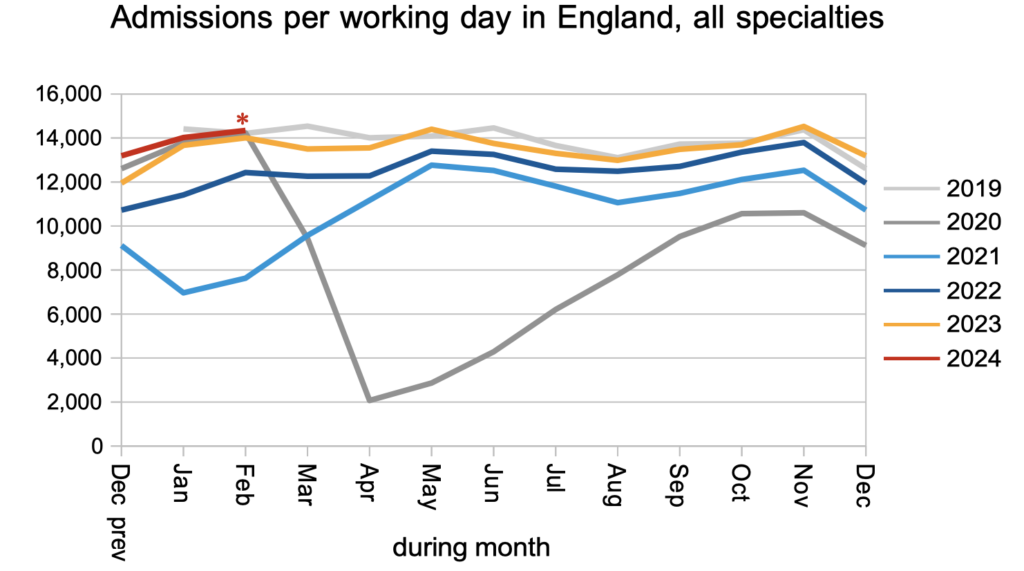
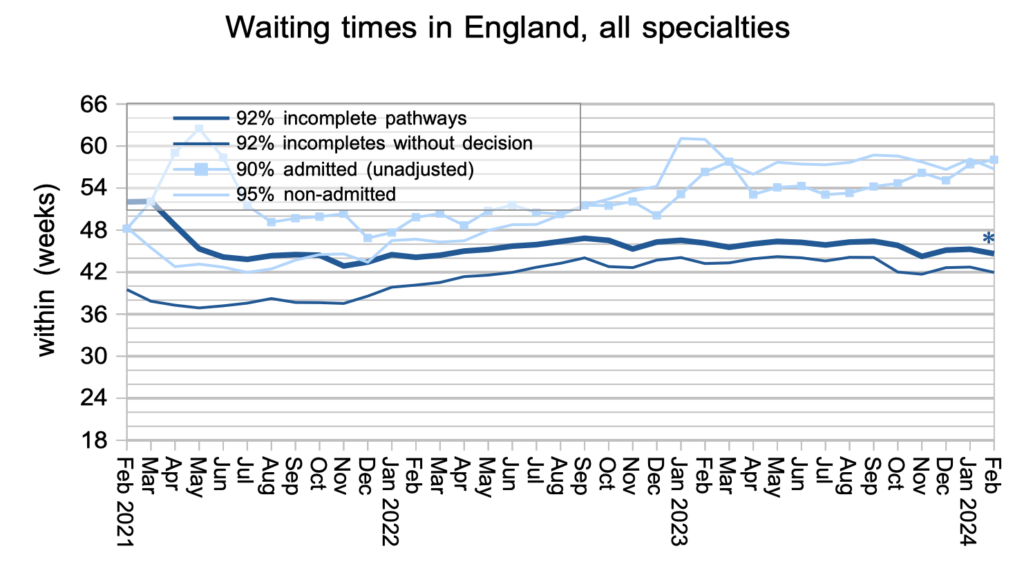
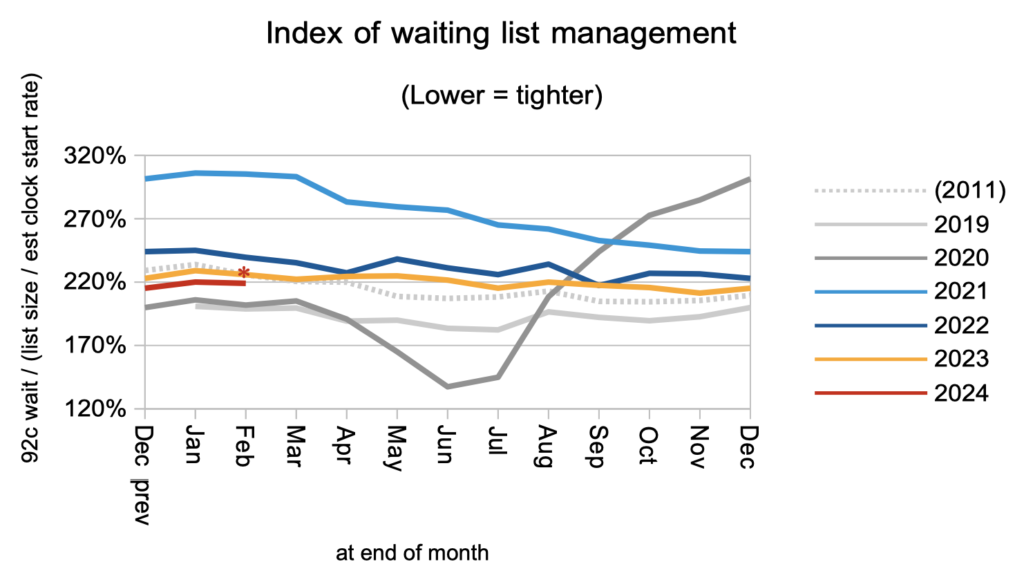
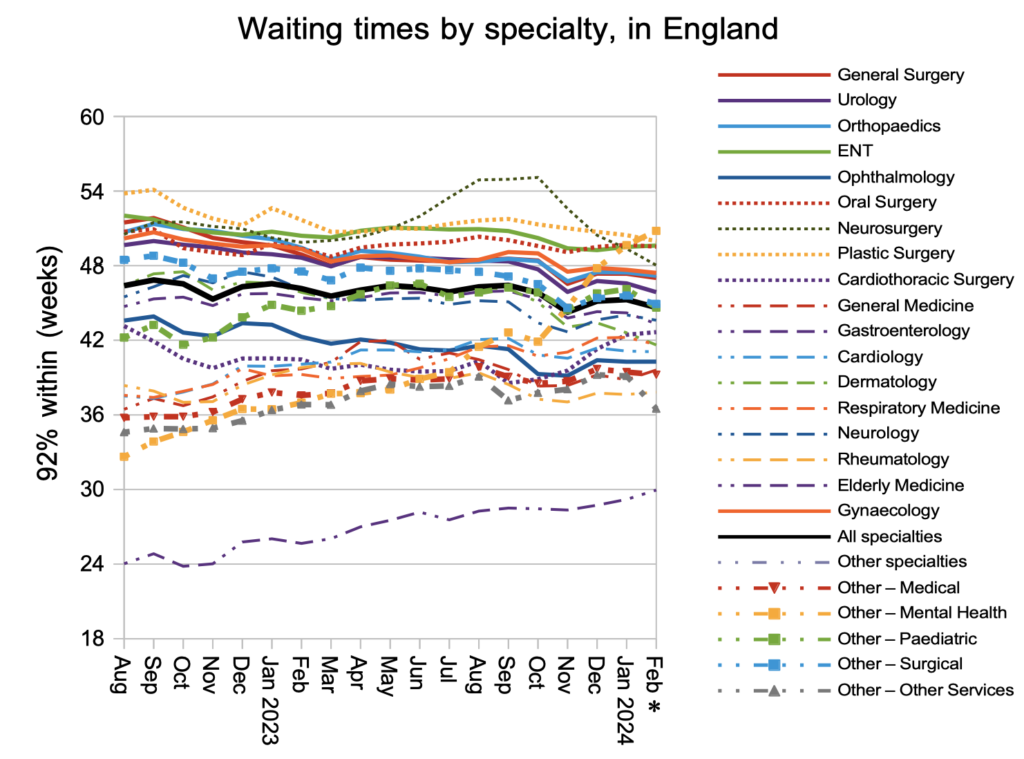
I have inserted asterisks (*) in the charts below as a reminder that community services are excluded from the data from February 2024.
Even allowing for the counting change, nothing dramatic happened to the clock start rate.
Nor the non-admitted clock stop rate (broadly, discharges from outpatient clinics and administrative removals).
The number of patients waiting for outpatients and diagnostics probably remained about the same, allowing for the disappearance of community services from the data. Among them were an estimated 27,073 patients whose eventual diagnosis will unexpectedly be cancer. These patients were not referred on a cancer pathway and are not protected by the cancer waiting time targets, so their typical wait for diagnosis is the same as everyone else’s: 42 weeks (over 9 months).
Nothing dramatic happened to the rate that patients were admitted for inpatient and daycase treatment.
The apparent fall in list size below is entirely explained by the disappearance of community services from the data. From its current size, the waiting list would need to roughly halve before the statutory 18 week waiting times target would be achievable again.
It is hard to draw firm conclusions about waiting times because of the counting change, but it is likely (looking at the change in 78 week waiters) that much of the apparent improvement is real. Those waiting times are, of course, still far too long.
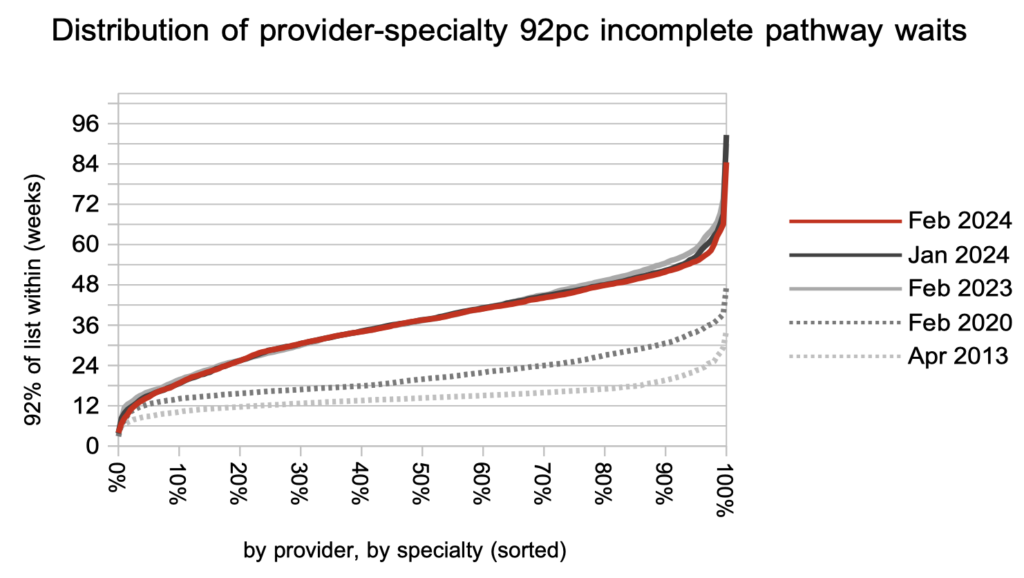
Waiting times are a function of both the size and shape of the waiting list. The shape remains significantly worse than before the pandemic.
Mental health became the longest-waiting specialty in February, and the long waits position is dominated by one large mental health trust. But I’m not going to name them here; instead I would like to give them credit for honestly reporting their position. If only all mental health trusts did the same.
The distribution in waiting times is unlikely to be much affected by the disappearance of a few community services. The longest wait position has somewhat improved over the past year in response to targets, however for most waiting list patients there has been no change. Things remain much, much worse than before the pandemic.
Referral-to-treatment data up to the end of March is due out at 9:30am on Thursday 9th May. The WLMDS gives us an indication of what it will say: roughly 174 patients still waiting over 104 weeks, 4,875 over 78 weeks, and an overall waiting list that may be starting to grow (in line with the seasonal pattern for a broadly stable waiting list). In other words, the targets are still being breached.
Return to Post Index
Leave a Reply
You must be logged in to post a comment.