
Accelerating elective recovery takes a pause
17/12/2024by Rob Findlay
The shift from a rapidly growing waiting list, to a rapidly shrinking one, failed to gather speed in October for the first time in over two years. If the government is to deliver its pledge to restore 18 week waits by 2029, the acceleration needs to resume until the list is shrinking by a million patient pathways per year. But in October the rate of improvement paused at less than 200,000 a year.
Improvement is still improvement. If the NHS is keeping up with demand, and the waiting list is shrinking consistently, then elective pressures are steadily melting away. The question is: how fast? At October’s rate, recovering the ’18 weeks’ standard would take decades. The government has pledged to deliver it in a single parliament.
In the following discussion, all figures come from NHS England. You can look up your trust and its prospects for achieving the waiting time targets here.
The numbers
The chart below shows the year-on-year change in the size of the English waiting list since just before the pandemic. It uses the unadjusted published data. However NHS England also publish data that is adjusted for non-reporting trusts, which shows that all the recent wobbles upwards were caused by non-reporting NHS trusts returning to the data series. Based on the adjusted data, October 2024 is the first month for over two years where the line did not trend continuously downwards.

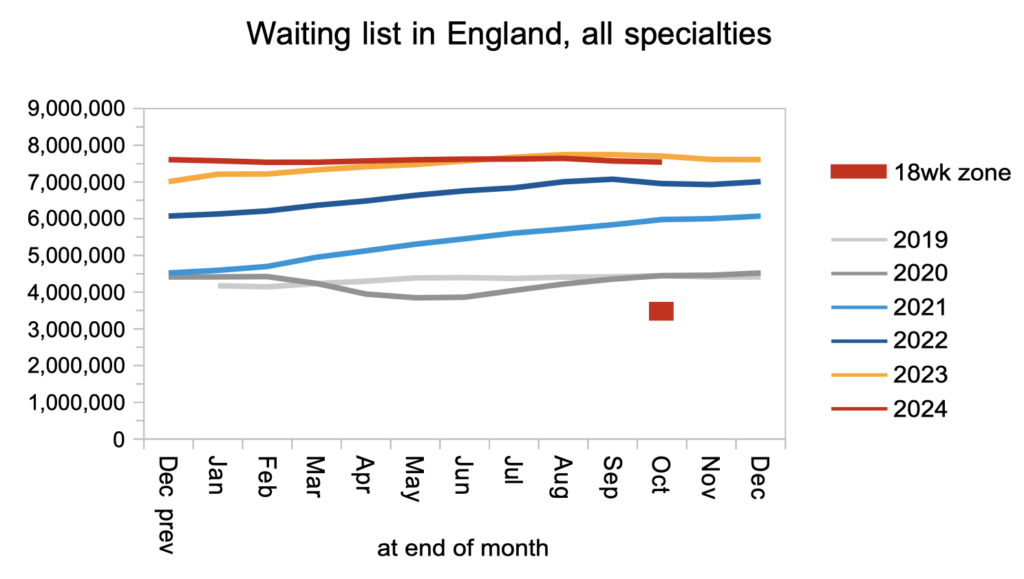
To deliver 18 weeks recovery, the waiting list needs to shrink all the way to the ’18 weeks’ zone marked in the next chart. That is about four million smaller than today’s waiting list. The government has pledged to restore 18 week waits in one parliament, which in practical terms means roughly the end of 2028-29: four full financial years away. That is why, instead of pausing where it is now, the year-on-year improvement line in the chart above would need to keep trending downward, until the list is shrinking by about one million per year. (It is also worth remembering that the reported waiting list figures currently omit large numbers of overdue ‘planned’ patients, such as overdue follow-up outpatients, because the Chapter 5 rule that they should be included in the figures is widely ignored.)
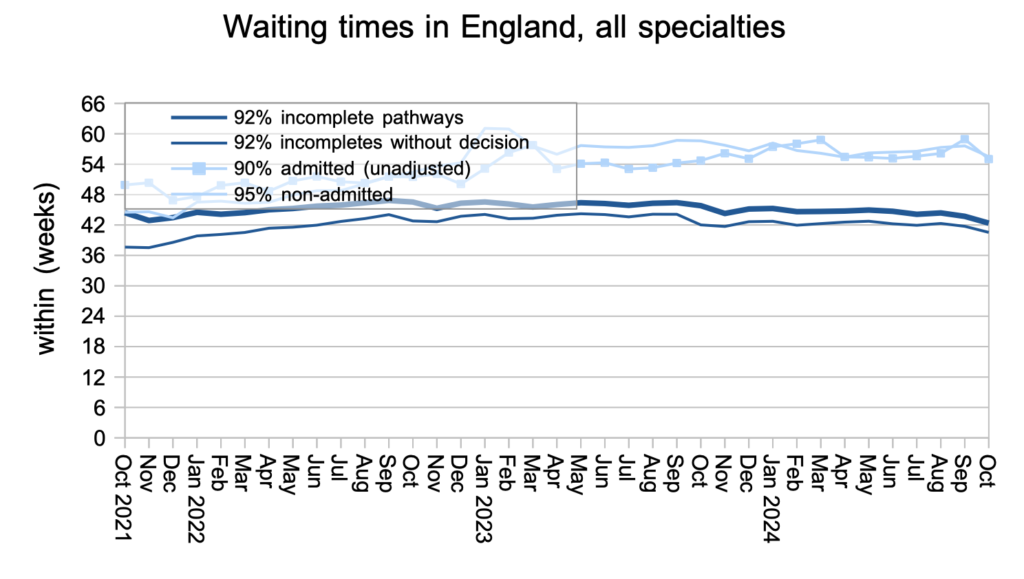
Waiting times nudged downwards in October, as they often do at this time of year. The waiting time from referral to ‘decision to admit’, which is indicated by the thinner dark line below, shows that patients are typically waiting over 40 weeks for a diagnosis and decision. Based on the October figures, I estimate that some 27,603 patients who are currently on the list will eventually receive an unexpected diagnosis of cancer, having been put at clinical risk by that long delay.
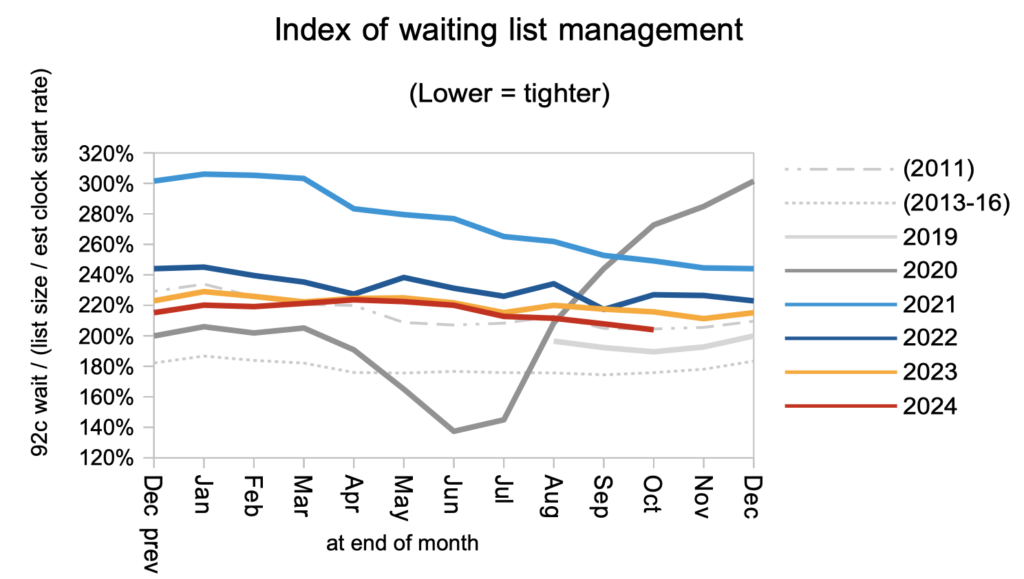
Waiting times are a function of both the size and shape of the waiting list, and the next chart is a measure of the shape. It remains at 2011 levels, which is significantly worse than the much better shape achieved in 2013-16. But it is likely that the shape will improve as the ’18 weeks’ recovery progresses.
Looking at the distribution of local waiting times around England, by trust and by specialty, there has been a sharp improvement at the long-waiting end of the distribution over the past year in response to the targets to eliminate the longest waiters. The main task now is to shift the whole distribution back to roughly April 2013 levels (the lowest grey line) to restore the ’18 weeks’ standard by 2029.

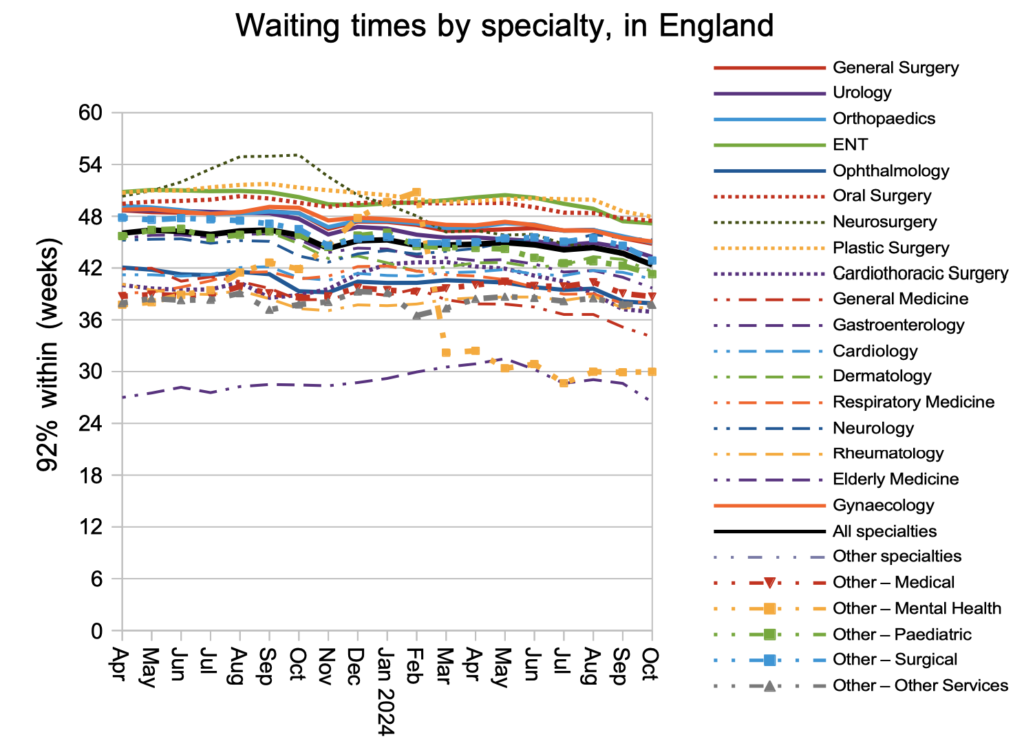
The improvement in waiting times was seen across the specialties. ENT is still the longest-waiting of the large surgical specialties.
Waiting lists shrink if patients are being treated and discharged from the waiting list faster than they are added to it. Unfortunately the published data does not give a complete picture of these flows, because 10-15 per cent vanish from the figures every month for various reasons. But the time trend is still meaningful, and the rate that patients were added to the waiting list (starting new waiting time ‘clocks’) was similar to last year and a little higher than pre-pandemic. The expected post-pandemic surge in elective demand never materialised.

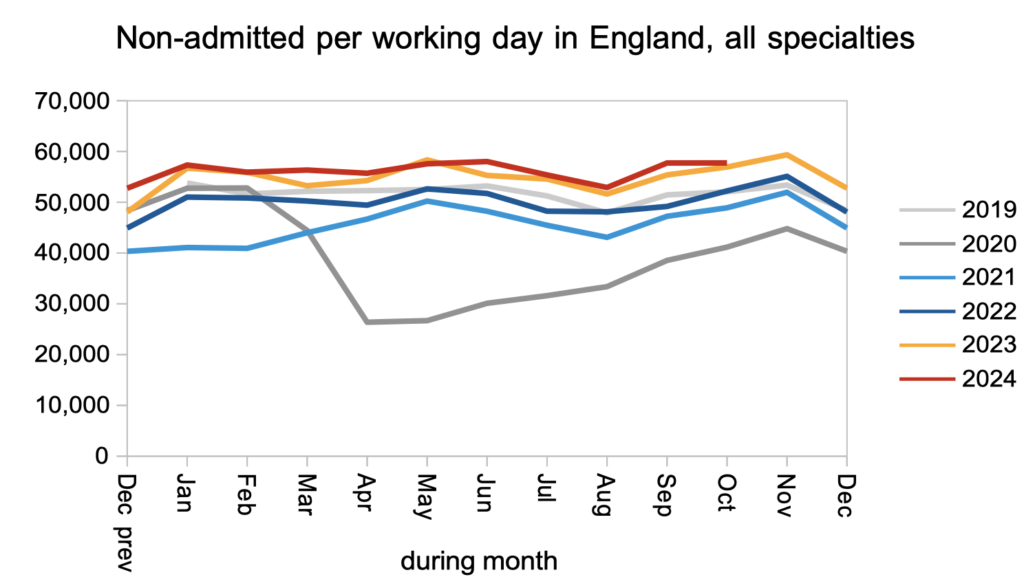
Patients were discharged from outpatient clinics (as ‘non-admitted clock stops’) faster than pre-pandemic, and at a similar rate to this time last year. Most patients on the waiting list are waiting for outpatient appointments and diagnostics, so increasing those kinds of activity has the biggest impact on the sheer numbers waiting, while also reducing the clinical risk for those patients whose eventual diagnosis will be a hitherto unsuspected cancer.
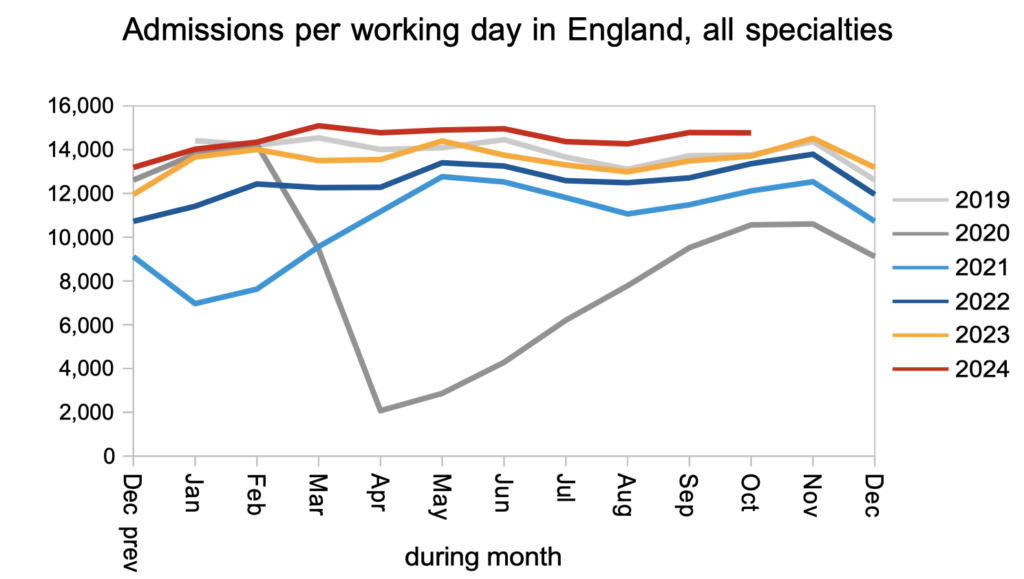
The rate that patients were admitted, for elective inpatient and daycase treatment, continued to be significantly faster than both last year and pre-pandemic.
Referral-to-treatment data up to the end of November is due out at 9:30am on Thursday 9th January.
Return to Post Index
Leave a Reply
You must be logged in to post a comment.