
Elective recovery on track after validation boost
17/06/2025by Rob Findlay
The English NHS cut its referral-to-treatment (RTT) elective waiting list by 32,000 patient pathways in April, beating the 20,000 required for a trajectory to restore the ’18 weeks’ waiting time standard by March 2029 as the government has pledged.
As former Number 10 advisor Bill Morgan pointed out on X, the backlog clearance was boosted by a one-off ‘validation’ exercise, in which waiting list records are checked for accuracy and corrected or removed if in error.
NHS England cheered that this validation “has delivered excellent results, with more than 100k pathways removed from the list above baseline in just six weeks – meaning that priority can be given to those patients needing care.”
The last bit of that quote is important, because the purpose of validation is not to make the numbers look better – it is to ensure that the data is accurate, so that capacity can be fully used, and patients are properly managed and never ‘lost in the system’.
Validation should be a continuous process of data maintenance, and the impact of these one-off efforts will fade as the data errors are corrected. Then we will find out whether the NHS really is on a trajectory to success, or whether the numbers have been flattered by one-off validation.
In the following discussion, all figures come from NHS England. You can look up your trust and its prospects for achieving the waiting time targets here.
The numbers
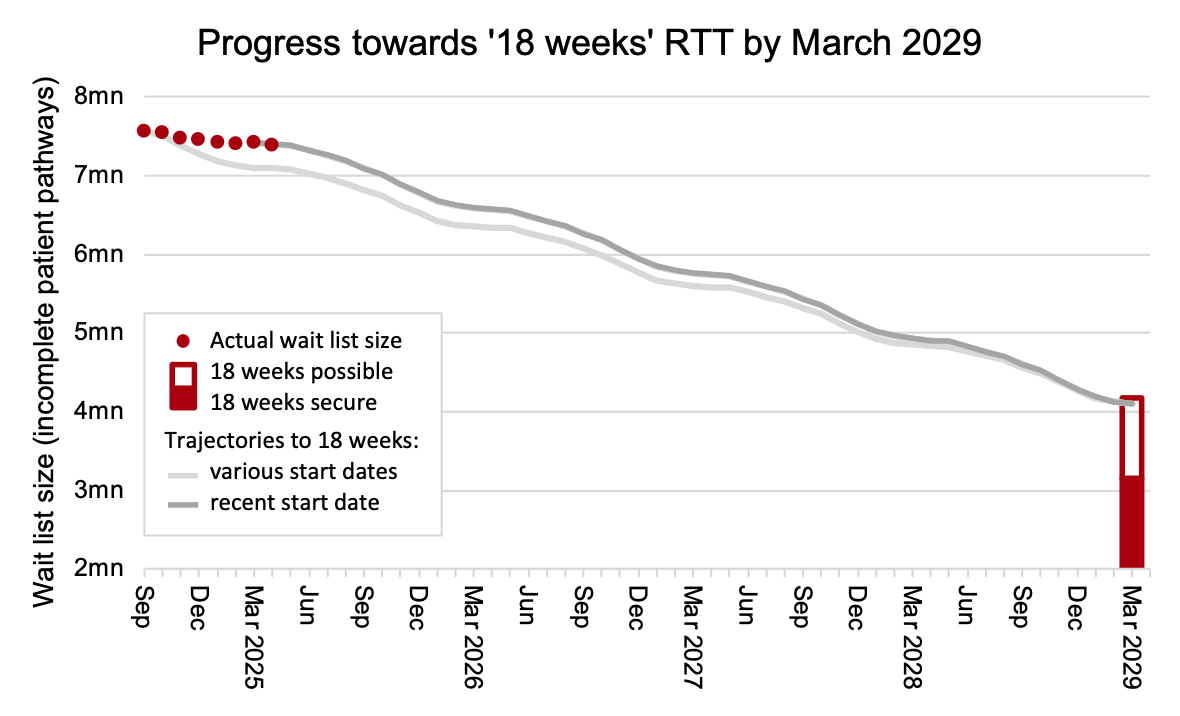
The first chart is new, and I will be refreshing it every month. It is fully explained here. In summary:
- The red dots show the actual waiting list size.
- The grey lines show how it needs to change up to March 2029, to plausibly restore the ’18 weeks’ waiting times standard with a good waiting list shape (as achieved from 2013-16) and assuming 2.5 per cent annual demand growth (as seen before the pandemic).
- The hollow red column in March 2029 shows a range of alternative scenarios where the waiting list shape is worse and/or demand growth is different.
The waiting list change was -31,628 in April, better than the latest trajectory which required a change of -19,795. So after one month of the latest trajectory, the waiting list size is 11,833 better than the trajectory for restoring 18 weeks by March 2029.
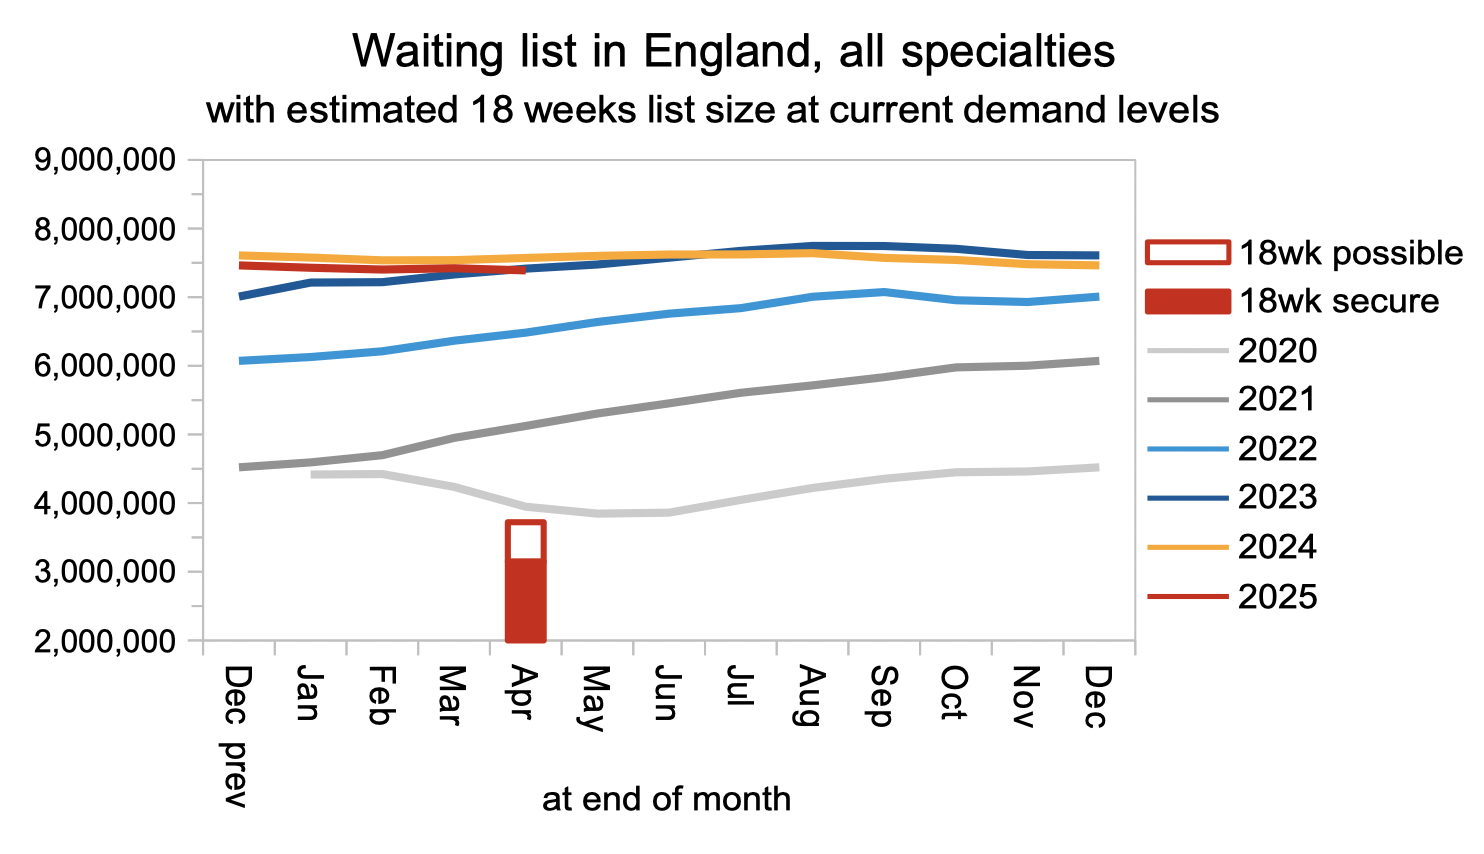
The shrinking waiting list also beat the usual seasonal growth. In the chart below, the red column shows the range of waiting list sizes consistent with potentially delivering the 18 weeks standard, depending on the waiting list shape. This column differs from the one in the chart above, because it is based on current levels of demand growth, whereas the chart above is a projection to March 2029 and includes a range of demand growth scenarios from now until then.
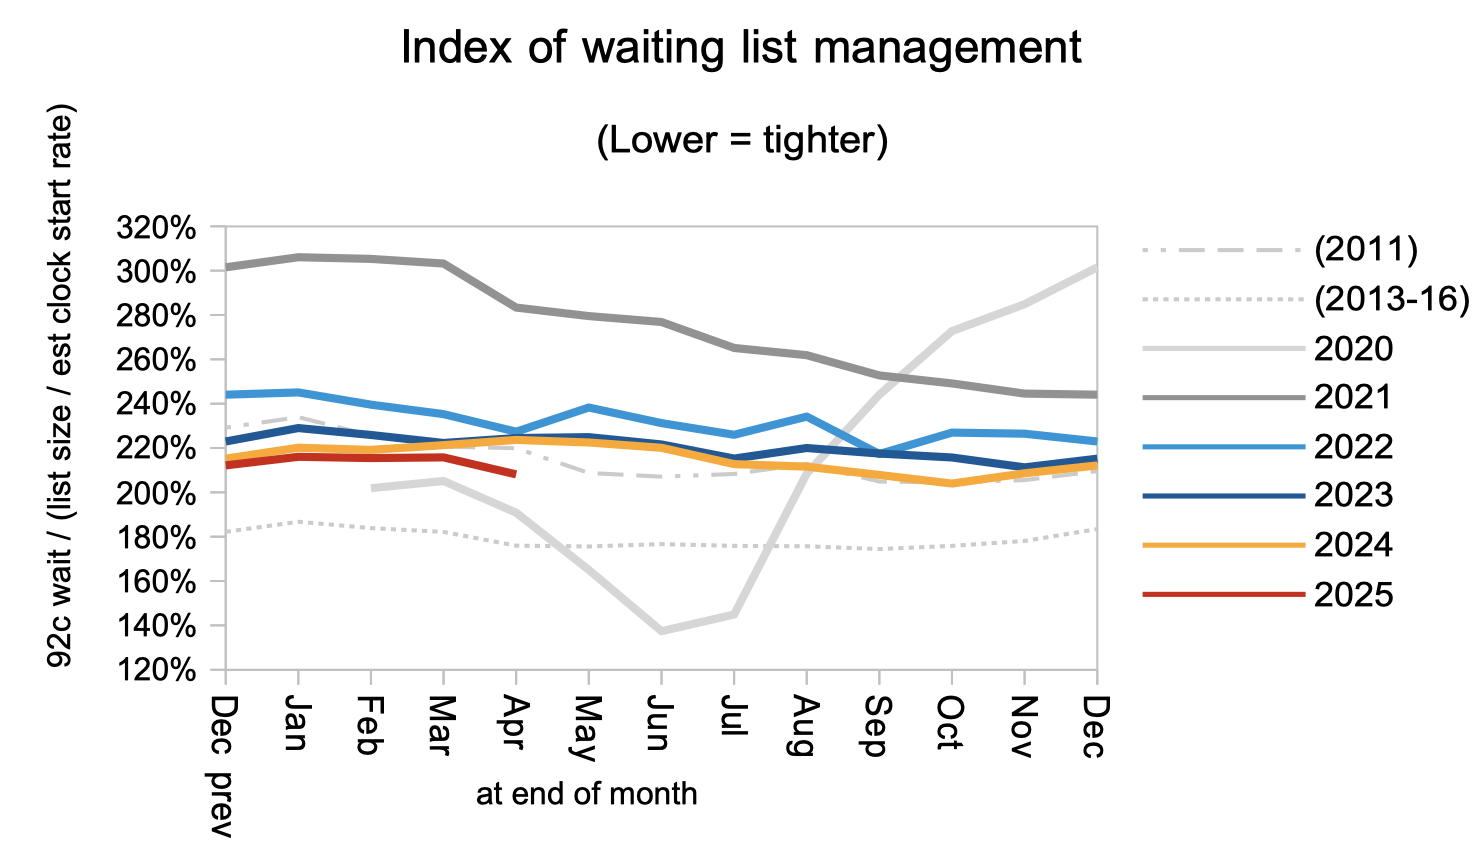
The waiting list shape improved in April, which could be explained by a validation exercise removing long waiters from the list. In the progress chart at the top, I am assuming that the shape of the waiting list shape continues to improve to levels last seen in 2013-16. A plausible reason why ’18 weeks’ might be missed in 2029 is a failure to achieve this better waiting list shape nationally, for instance because of:
- poorly designed interim targets encouraging the NHS to focus on light casemix patients, leaving the heavier casemix until it is too late;
- spending limited resources on services that don’t really need them, starving those that do;
- systemic capacity shortfalls in particular subspecialties and/or geographies;
- ‘pop up’ data errors at the last minute.
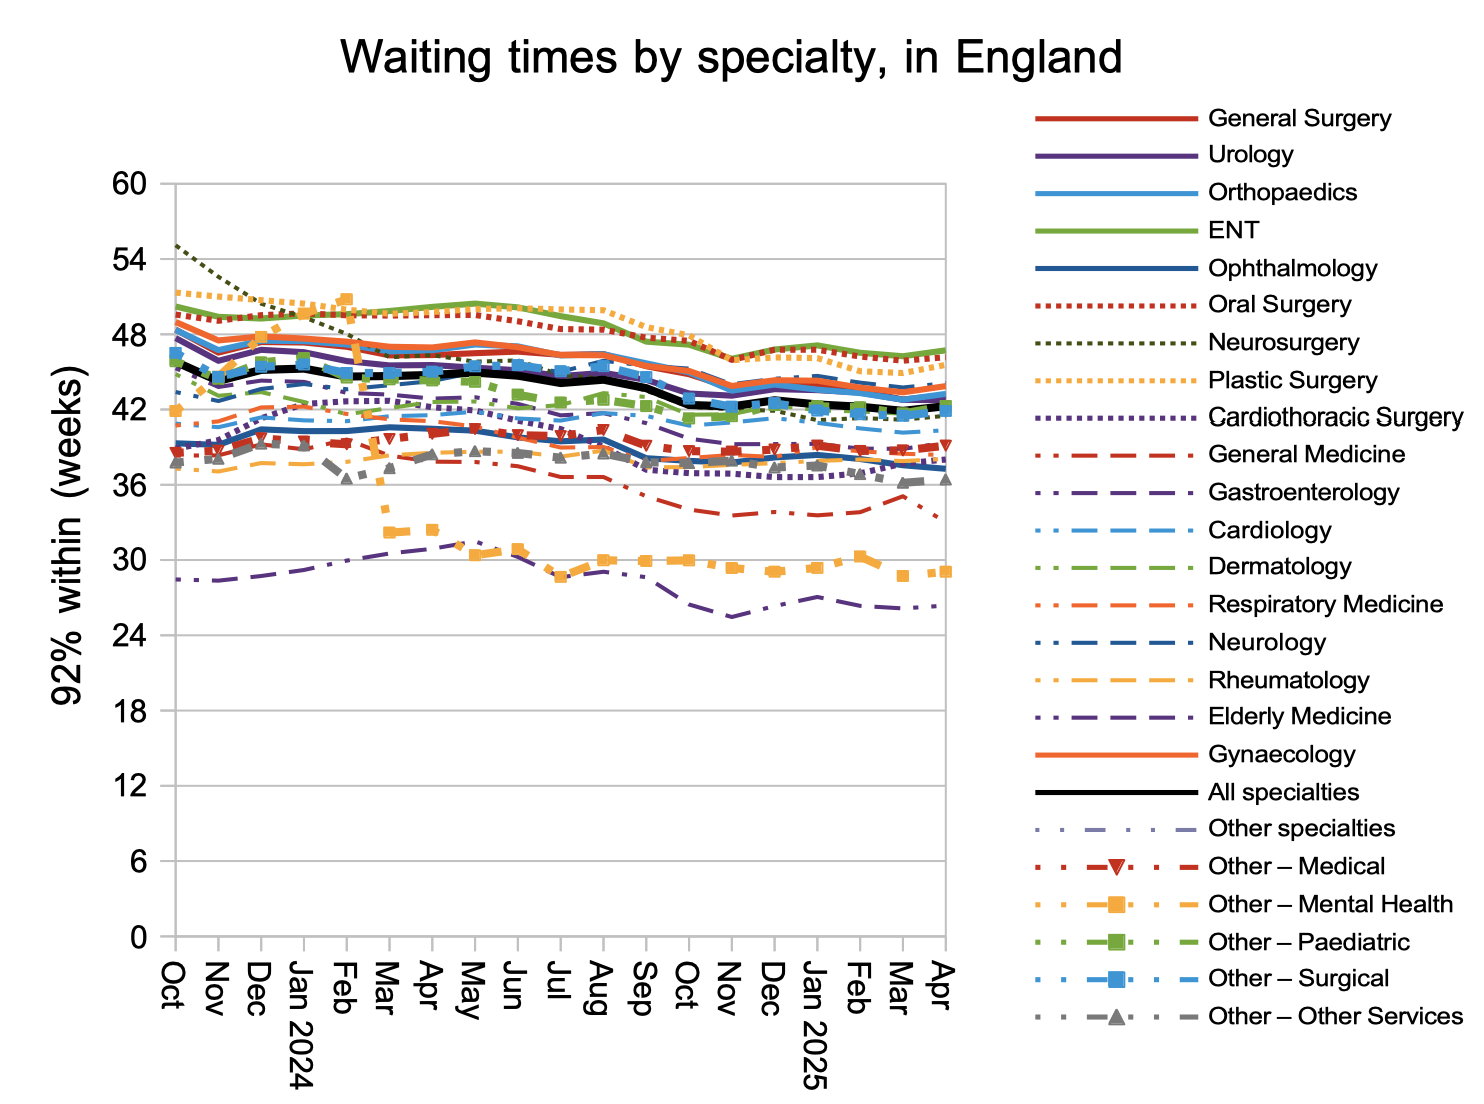
In spite of the otherwise good news, waiting times increased by 0.4 weeks to 42.3 weeks in April. The number of 52-week breaches increased by 10,000 to 190,000 patient pathways, with increases in 65-, 78- and 104-week waiters as well.
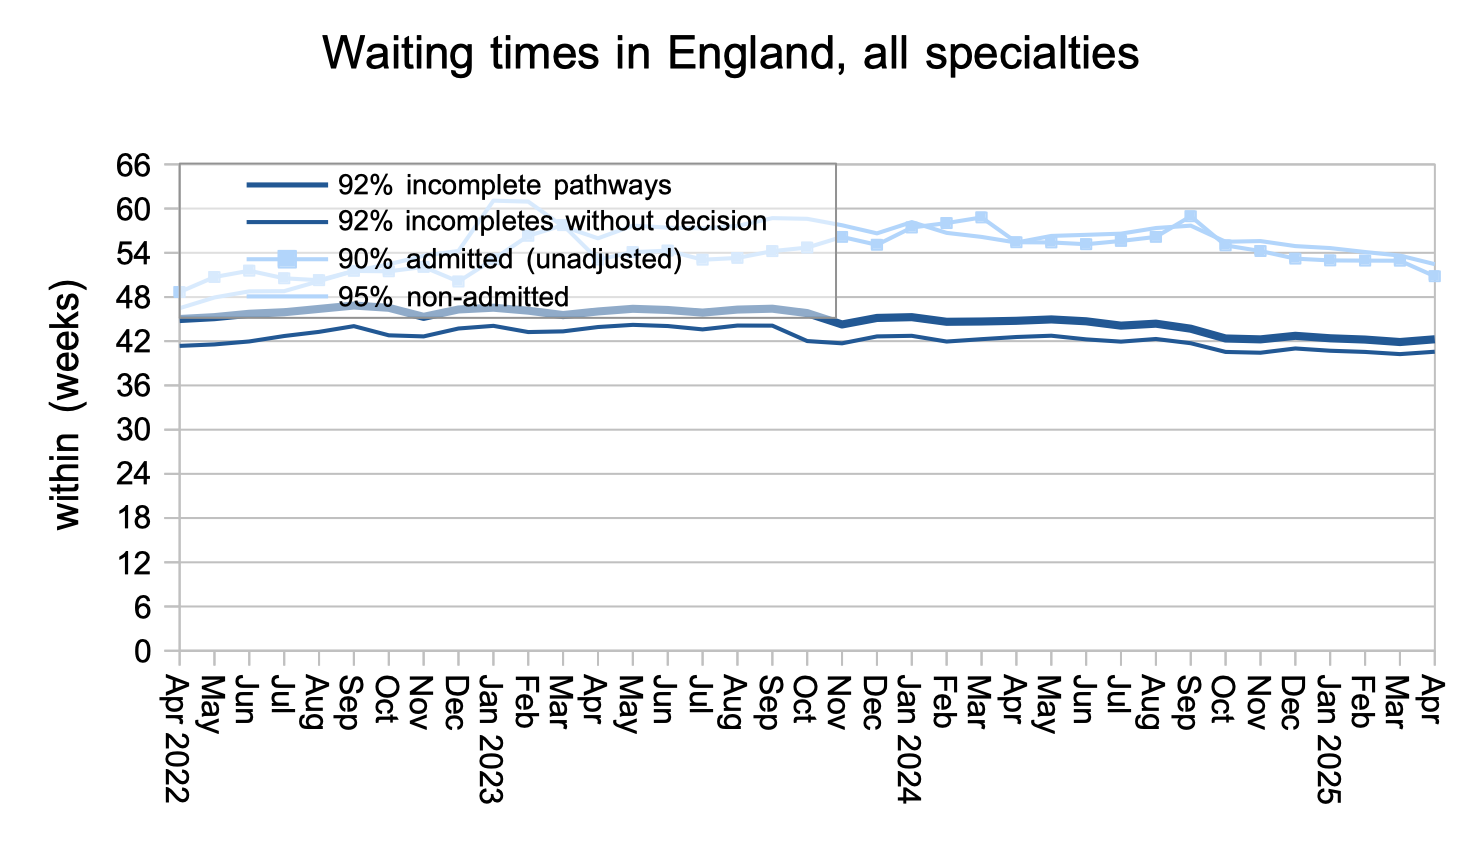
The general increase in waiting times was seen in all the main surgical specialties, except for Urology and Ophthalmology which improved.
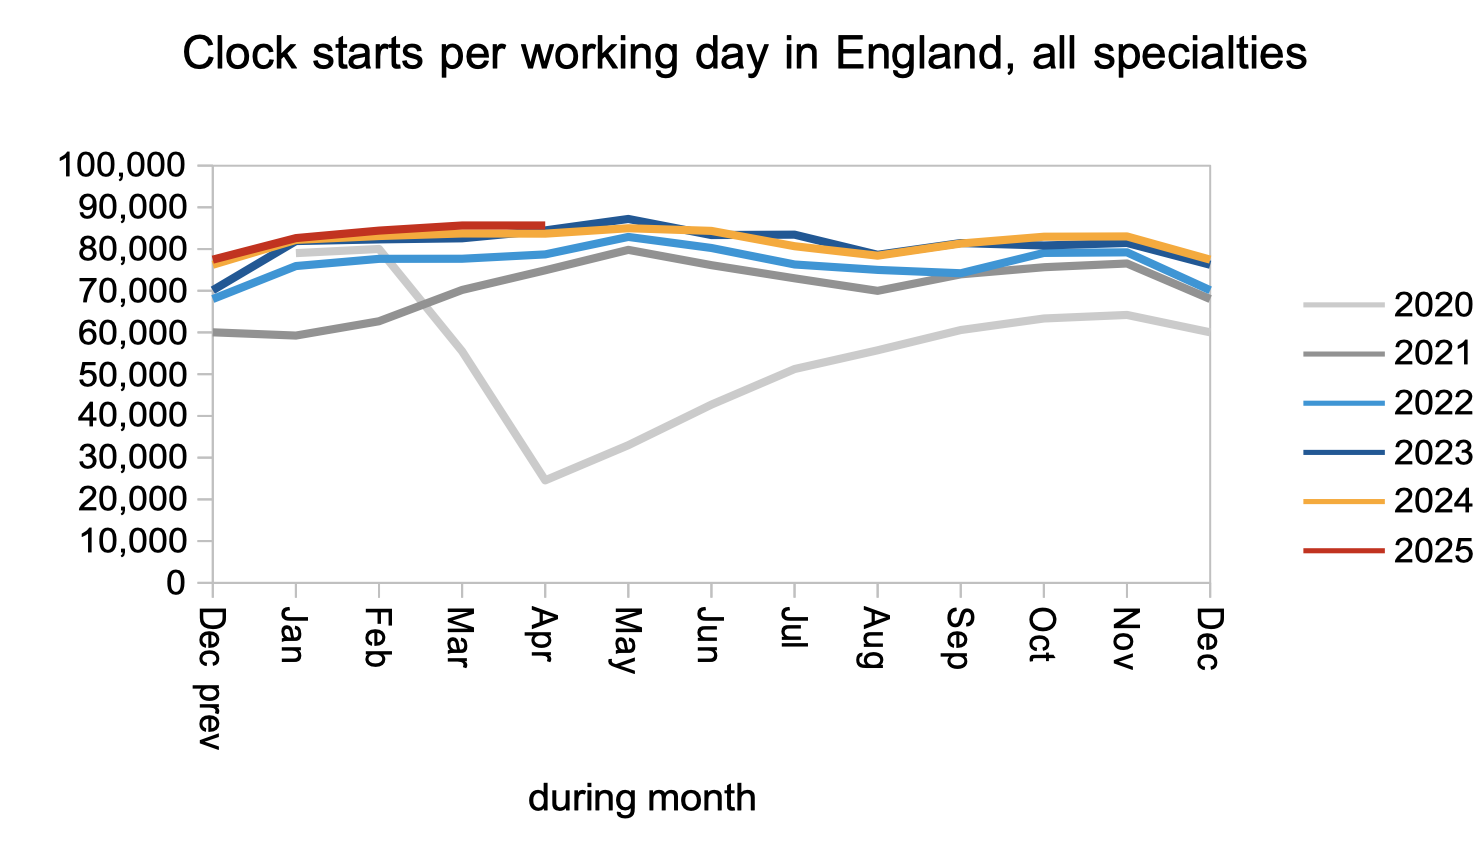
Let us turn now to demand, activity, and removals because of validation, which add up to changes in the size of the waiting list. Patients started new waiting time ‘clocks’ – our best measure of demand – at a similar rate to last year.
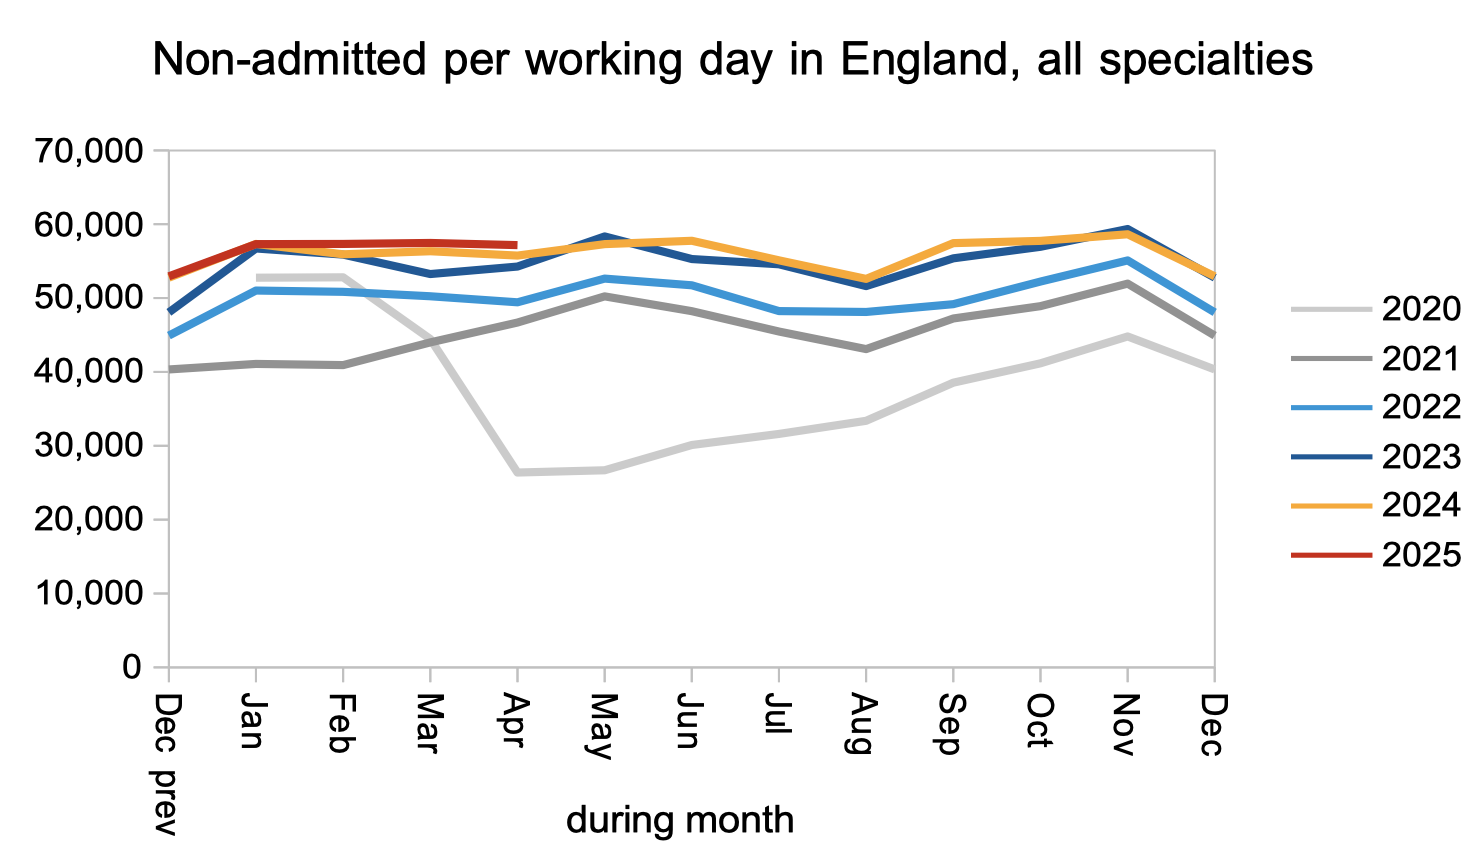
Patients were discharged from the waiting list from outpatient clinics (or otherwise had a ‘clock stop’ for any reason other than admission for inpatient or daycase treatment) at a slightly higher rate than last year.
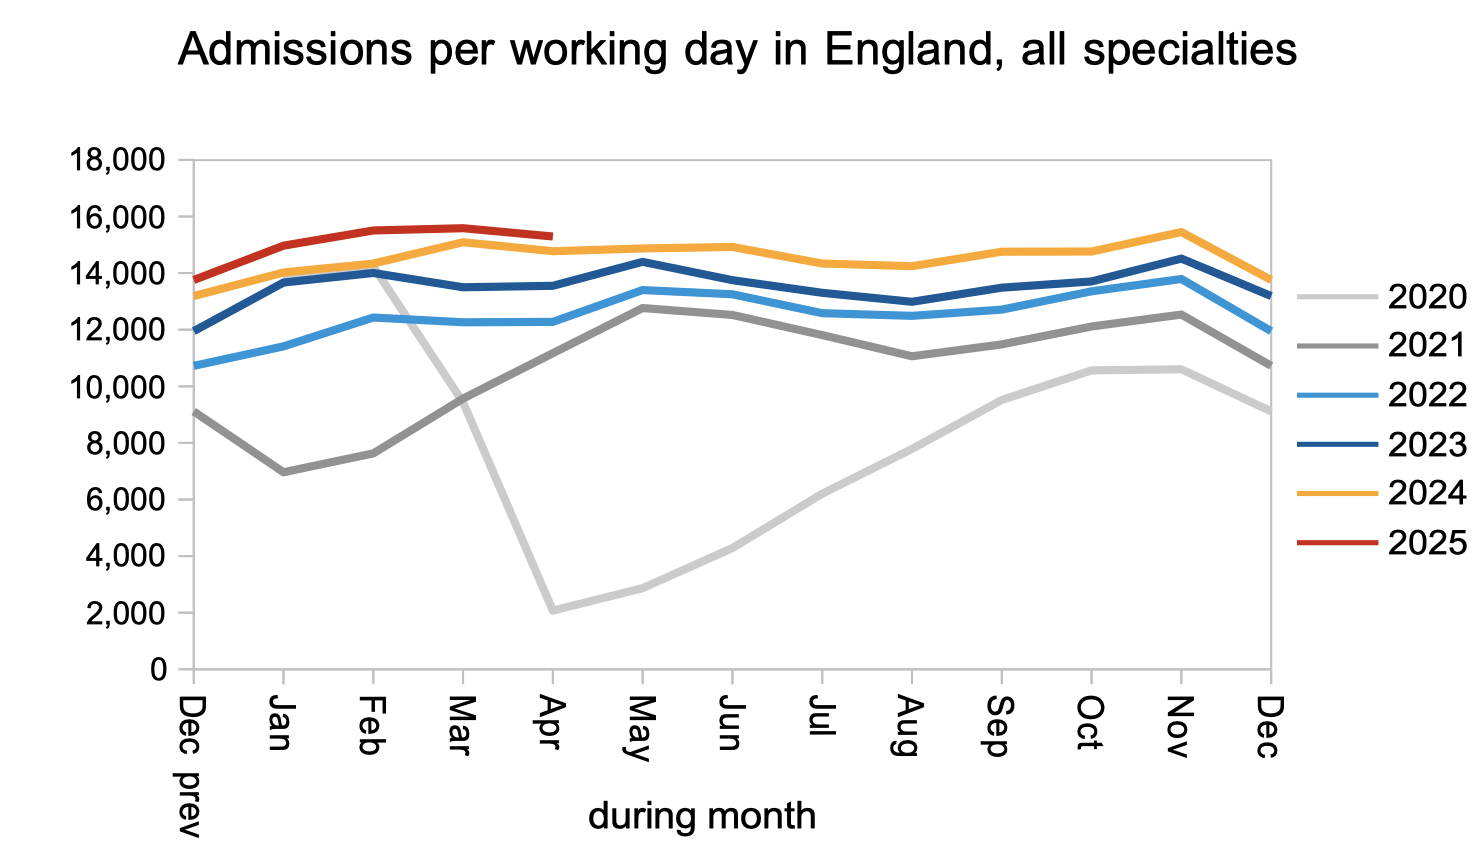
Patients were admitted for inpatient and daycase treatment at a slightly higher rate than last year.
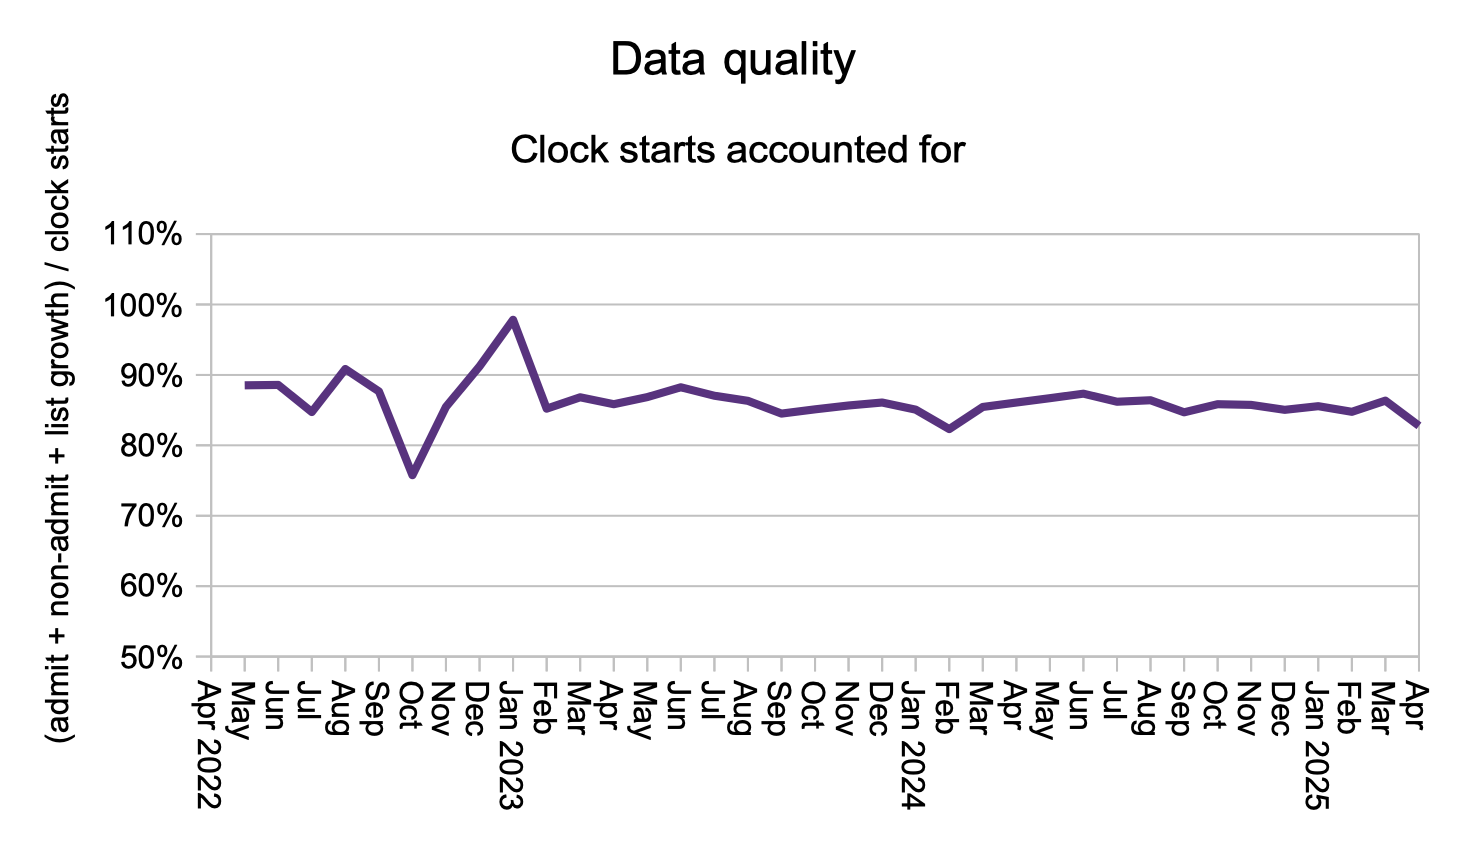
Finally, patients disappeared from the waiting list, without scoring as admitted or non-admitted clock stops, at a higher rate than usual in April, which again points to an increase in validation removals.
Referral-to-treatment data up to the end of May 2025 is due out at 9:30am on Thursday 10th July.
Return to Post Index
Leave a Reply
You must be logged in to post a comment.