
Waiting list veers off track
18/09/2025by Rob Findlay
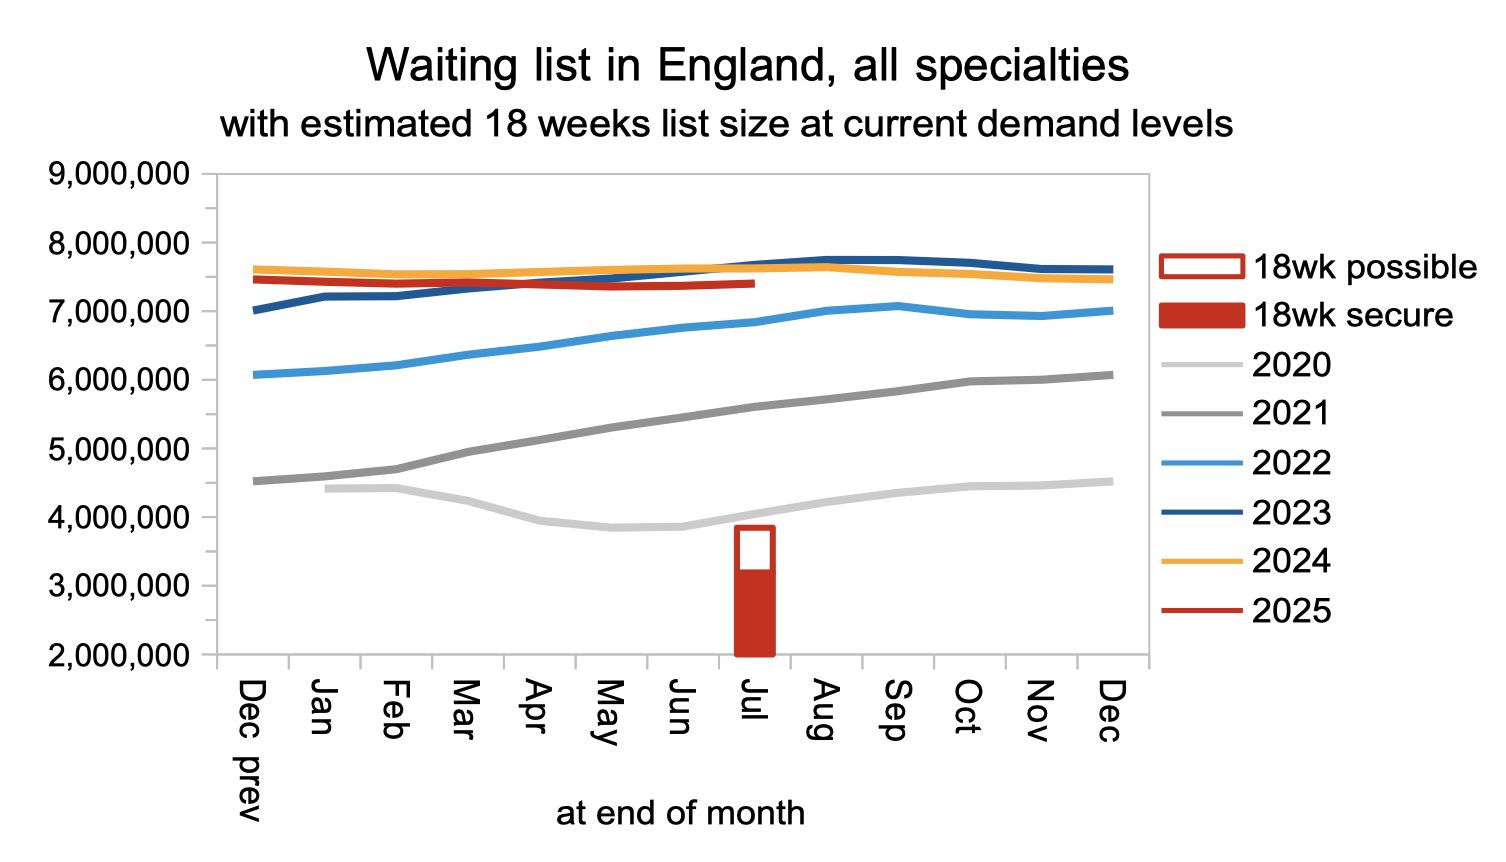
England’s waiting list should have shrunk by 60,000 patient pathways in July, to stay on track for restoring the ’18 weeks’ standard by March 2029. It didn’t – it grew by 34,000.
This brings to a decisive end the run of waiting list reductions that started the financial year, which were largely caused by a big national ‘validation’ exercise to remove patients who were on the waiting list in error. Validation continued in July, but its effect is not visible in this data. And the government says the strike by resident doctors had only a modest impact.
Amidst the noise, it is worth remembering that it is waiting lists and waiting times that really matter here, rather than activity (which is a contributor to the desired result). When a government news release emphasises activity above all else, it is usually a sign that things are not going well.
In the following discussion, all figures come from NHS England. You can look up your trust and its prospects for achieving the waiting time targets here.
The numbers
The English NHS drifted off track for 18 weeks recovery, as the chart below shows (the method is explained here).
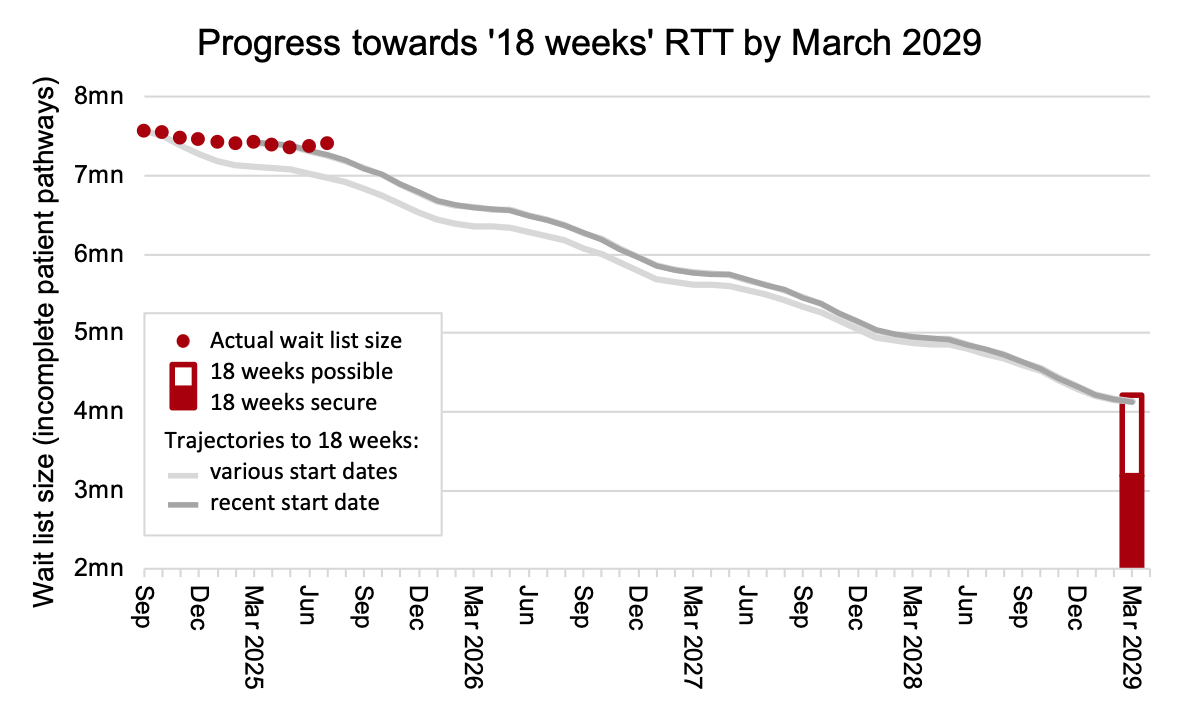
The increase in list size was not particularly large, but the problem was that it grew at all.
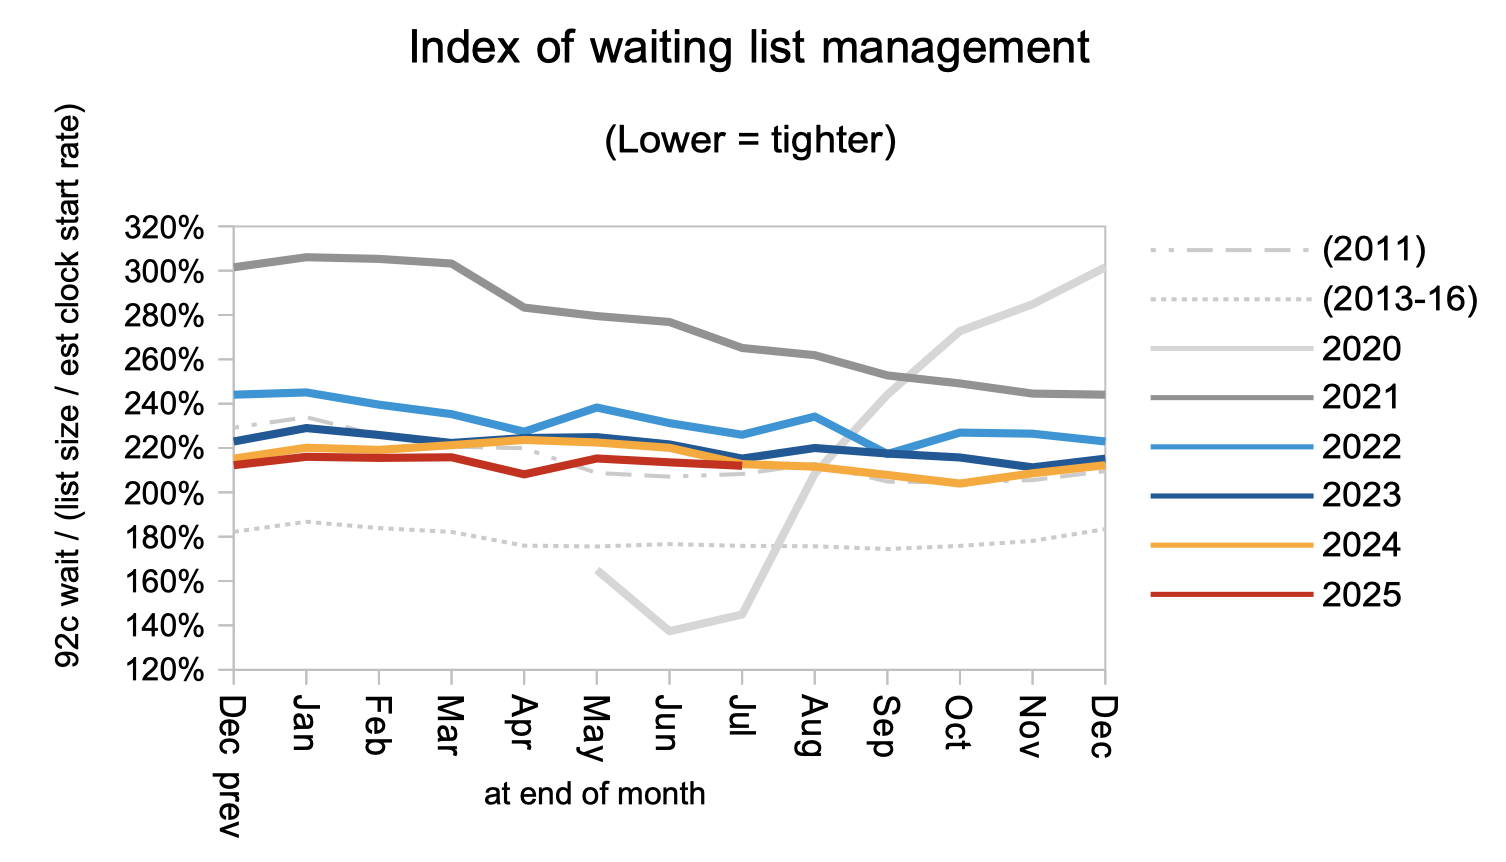
Waiting times, which are what matter to patients, are a function of both the size and shape of the waiting list. The shape is summarised by the chart below, and it remained worse than in 2011 when poorly designed targets were penalising hospitals for treating long-waiting patients. Although the shape is expected to improve as the waiting list comes down, this cannot be taken for granted and it would be helpful if the approaching planning guidance were to improve the design of the NHS’s interim targets for next financial year.
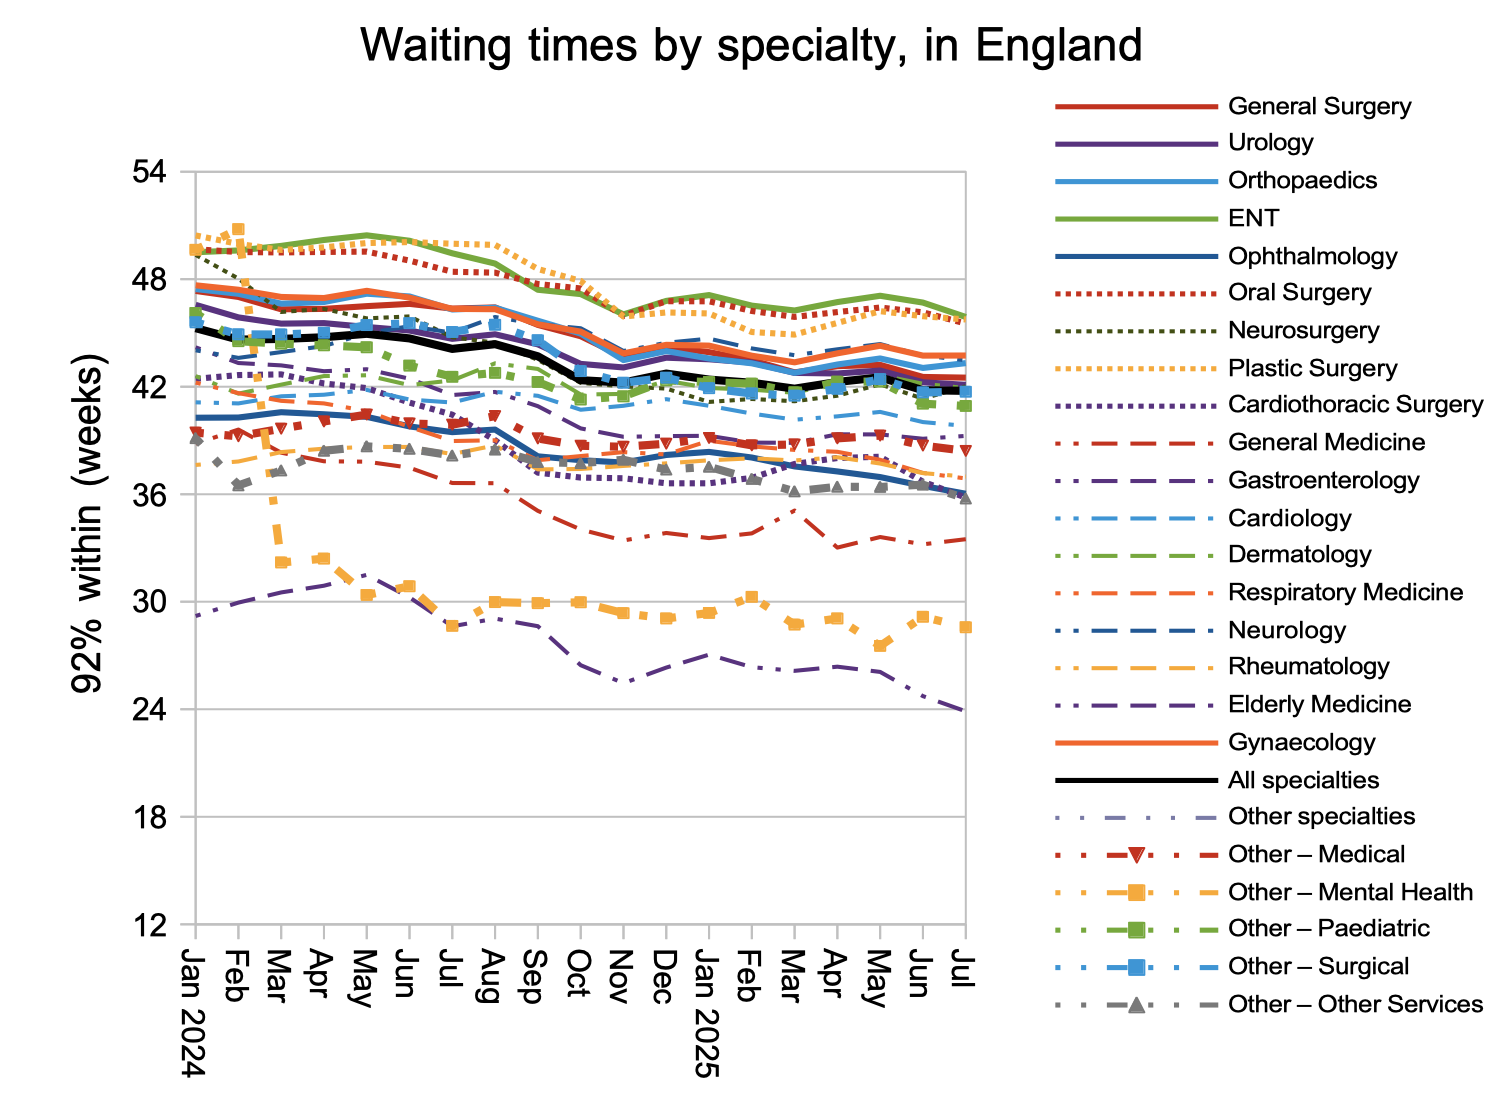
Waiting times remained steady – and far too long – in July.
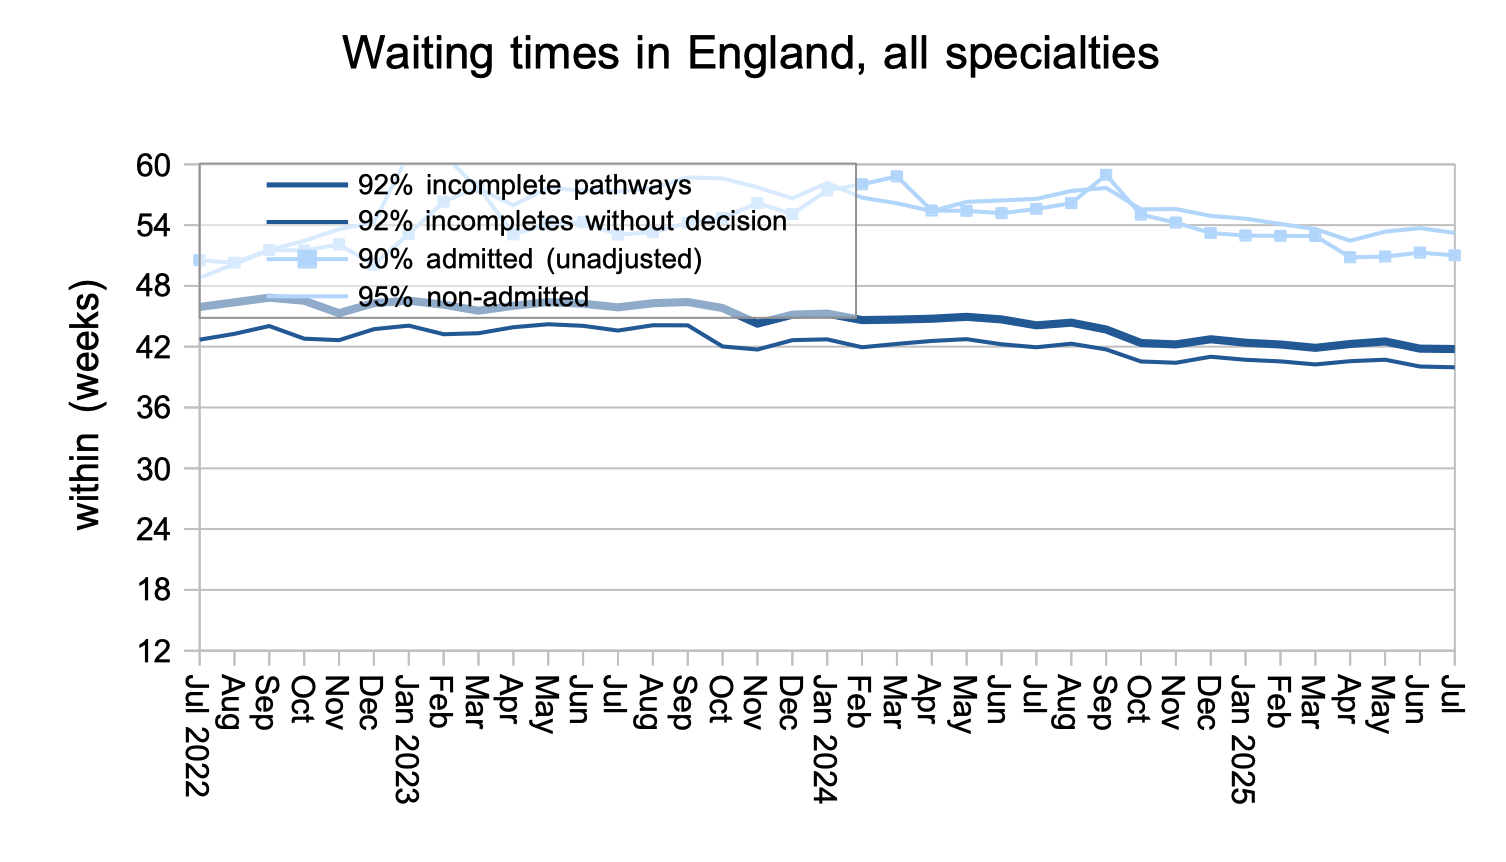
While long-waiting specialties such as ENT, Oral Surgery and Plastic Surgery improved their waiting times, others such as Orthopaedics, Neurosurgery and Gynaecology deteriorated.
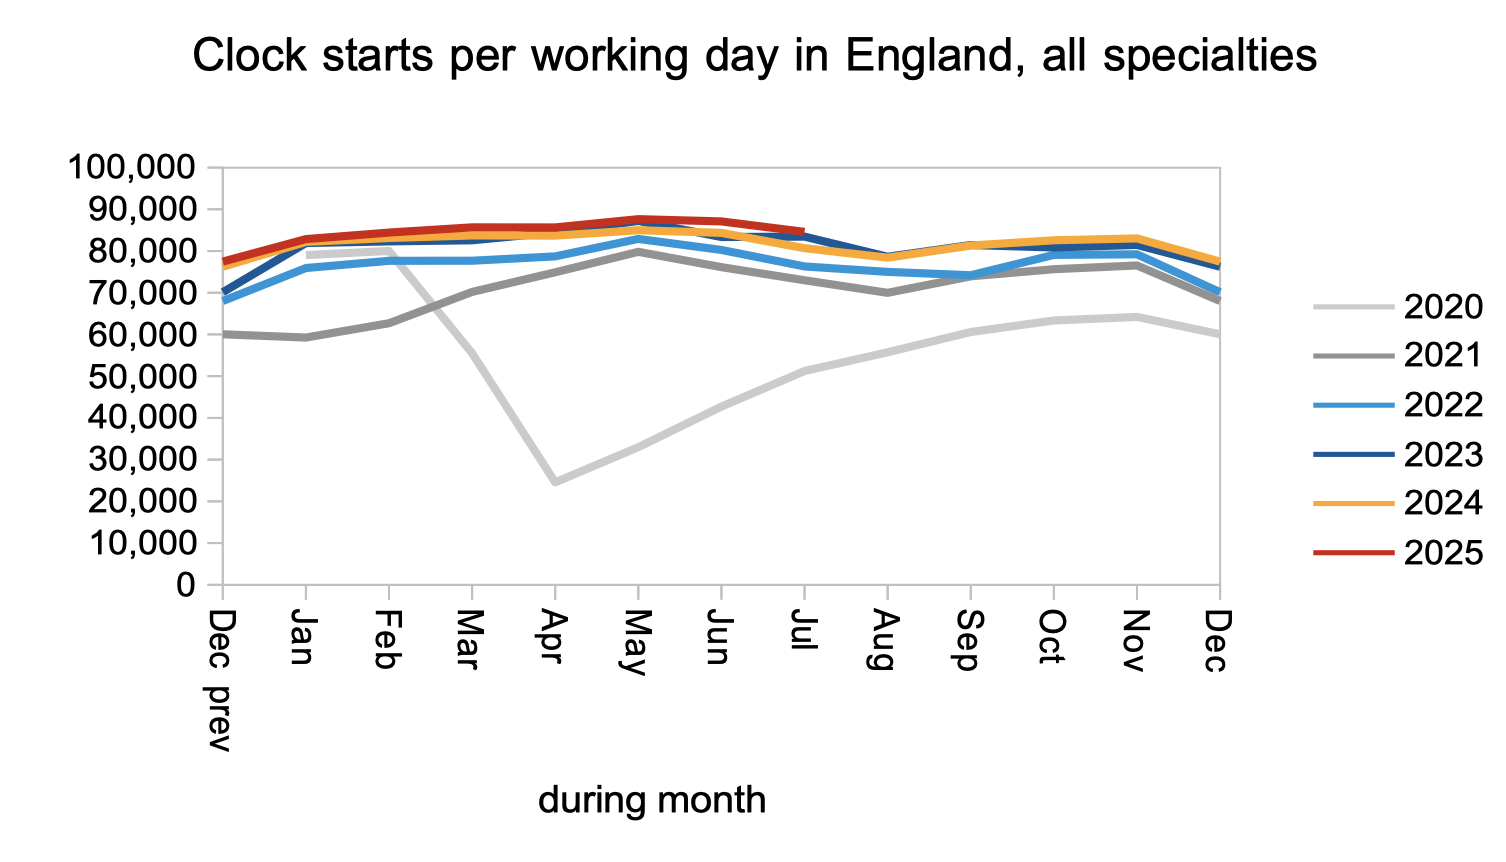
Demand, measured by the number of patients starting new waiting time ‘clocks’, remained somewhat higher than last year.
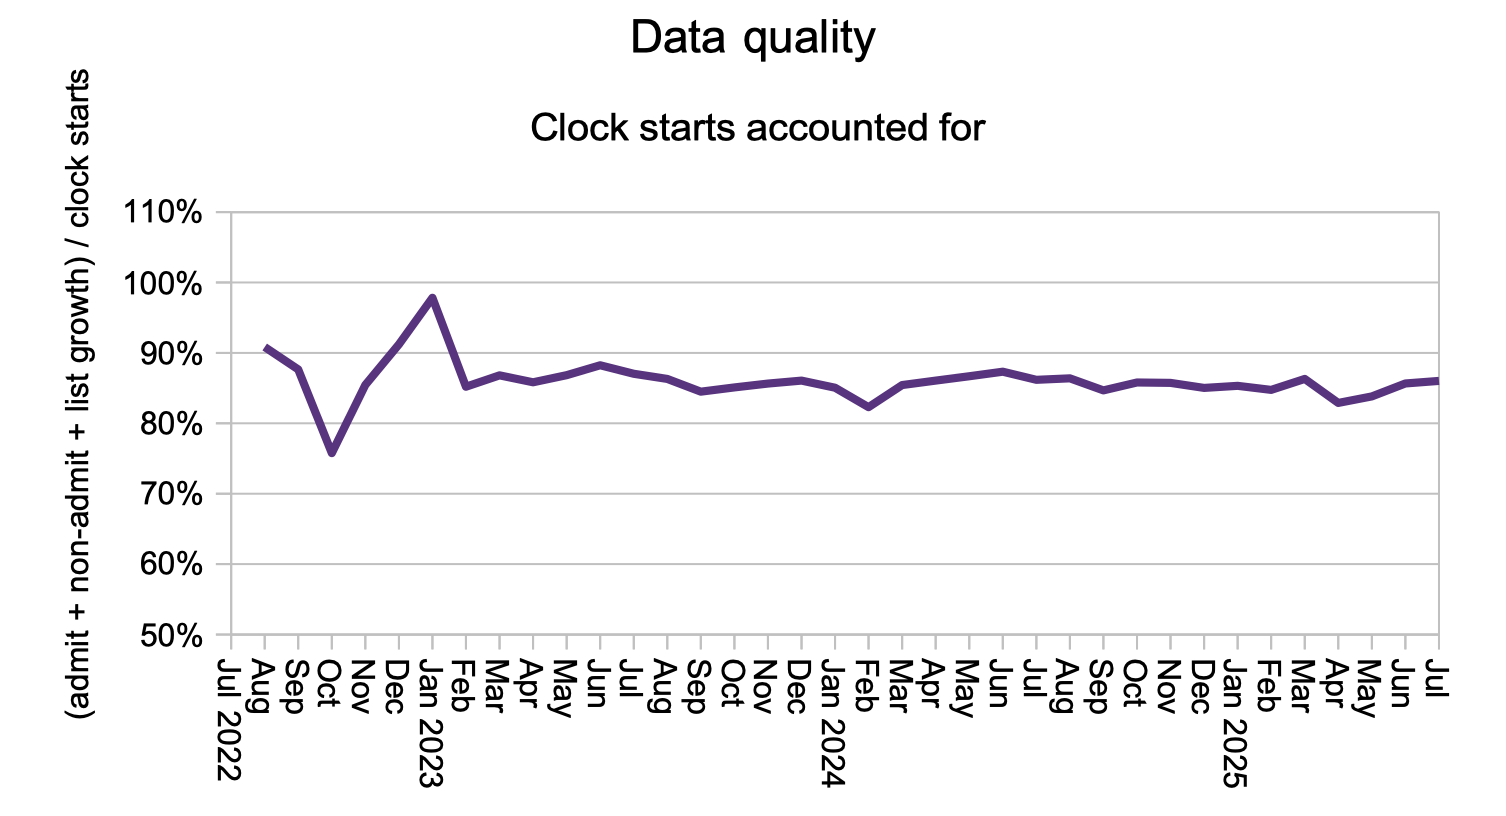
Validation involves checking through the waiting list and removing any patients who should not be there. Done well, it keeps the waiting list accurate, and ideally it should be part of the normal working day. Because validation results in patients being removed from the waiting list without scoring as a ‘clock stop’, it can be detected in the data as patients going missing without explanation.
The chart below shows that about 15 per cent of patients go missing in most months. When there is a major national validation drive it can cause the line to dip, as it did in April. There was no such dip in July, despite the ongoing push for more validation.
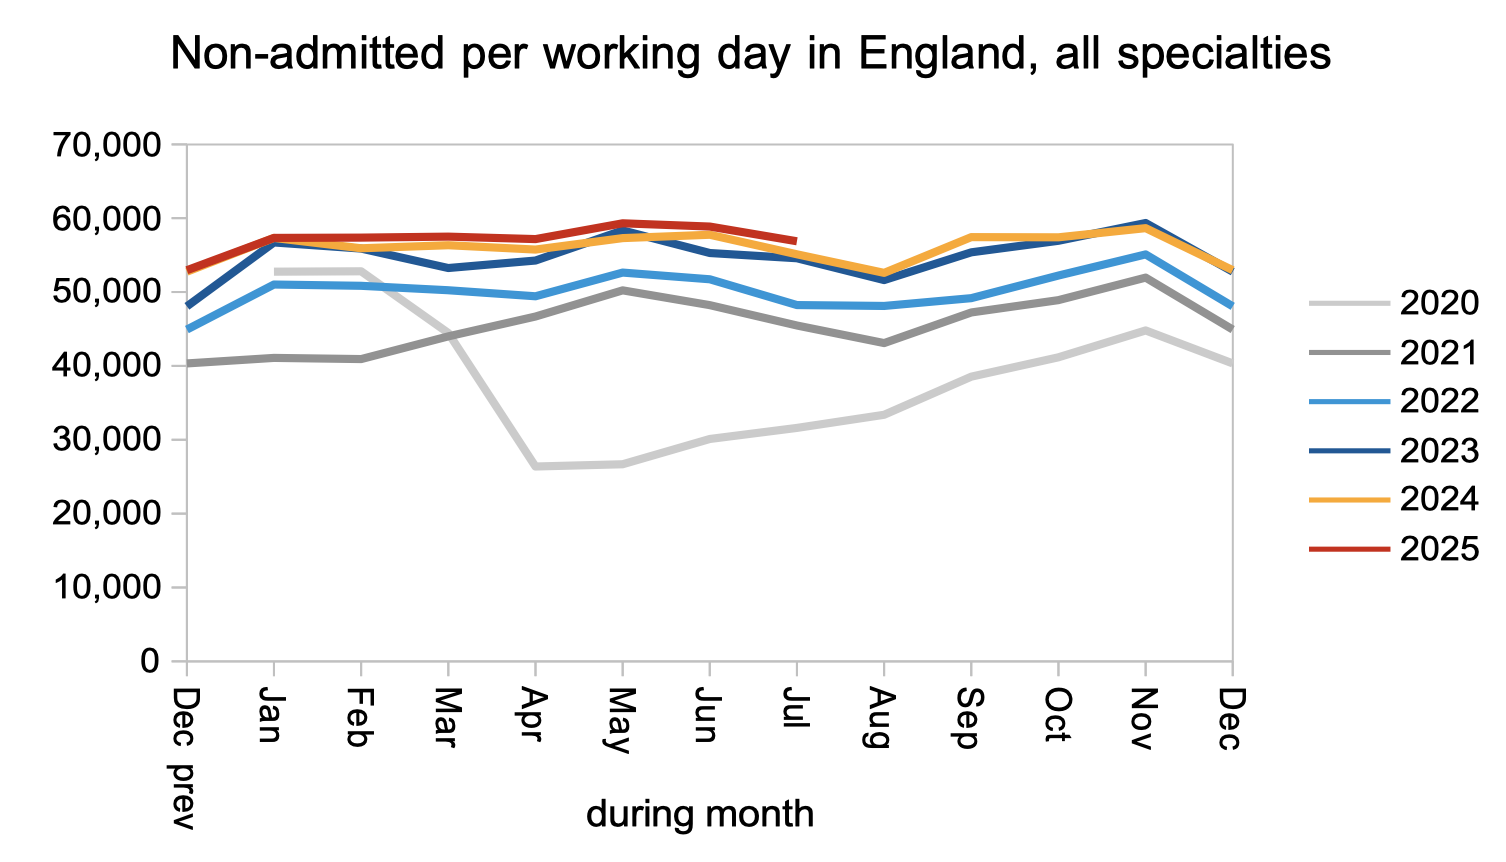
Patients were discharged from the waiting list without admission (mostly from outpatients and diagnostics) at a slightly higher rate than pre-pandemic. There was no visible impact from the resident doctors’ strike.
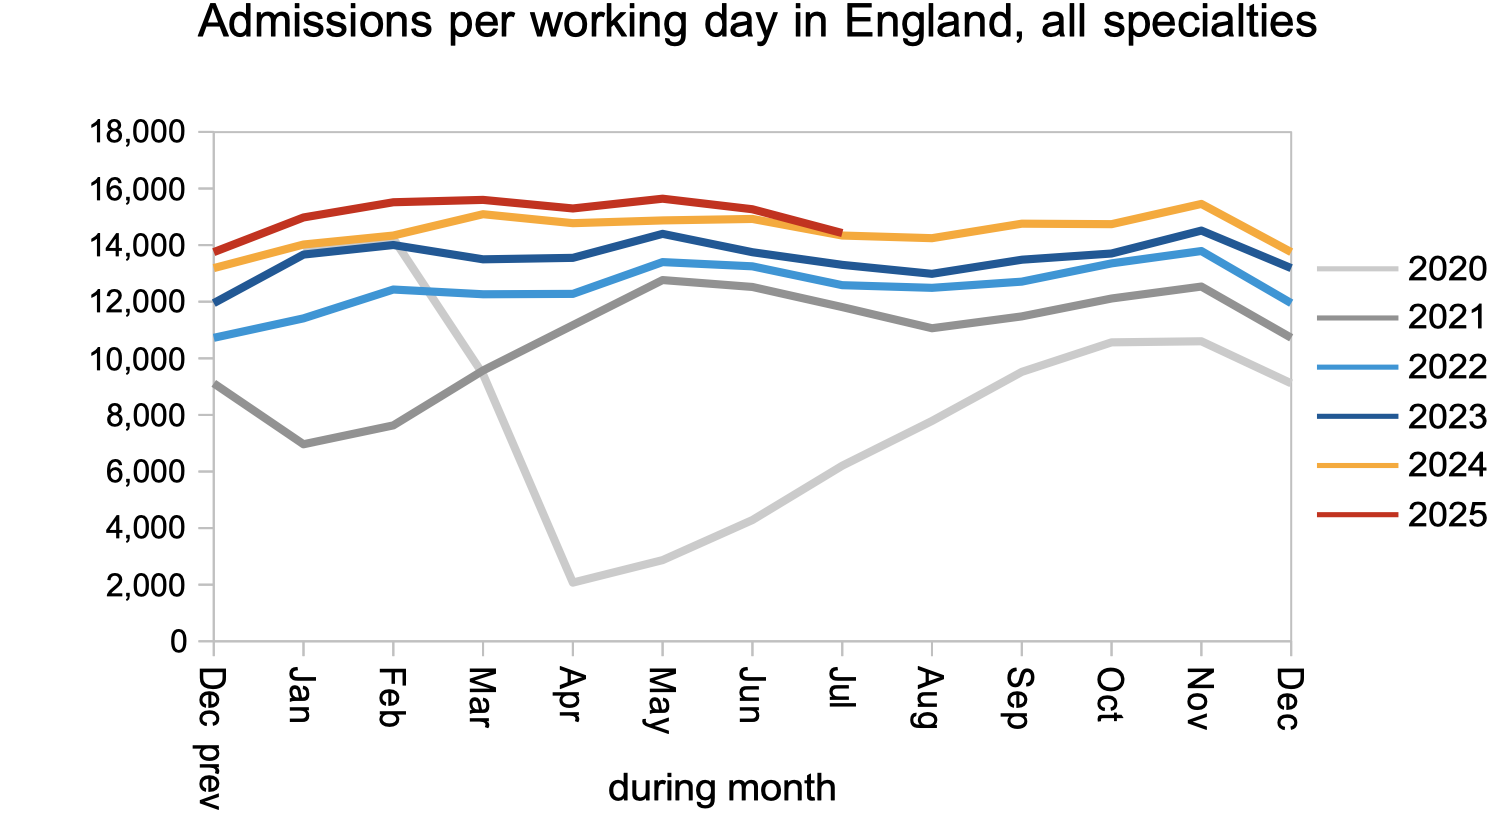
Admissions, on the other hand, dropped back to last year’s levels.
Referral-to-treatment data up to the end of August 2025 is due out at 9:30am on Thursday 9th October.
Return to Post Index
Leave a Reply
You must be logged in to post a comment.