England still off track for 18 weeks recovery
18/11/2025by Rob Findlay
If the English NHS were broadly keeping up with elective demand, so that the referral-to-treatment (RTT) waiting list neither grew nor shrank over the year, then in a typical September the list would shrink seasonally by around 28,000 patient pathways.
But the NHS has bigger ambitions than steady-state: it aims to tackle the post-covid backlog and restore the ’18 weeks’ waiting times standard by March 2029. That requires a big reduction in the waiting list, with September’s share of the reduction being some 98,000 pathways.
However, according to the latest data, the waiting list actually shrank by only 16,000 pathways in September, which is consistent with year-round growth in the waiting list rather than recovery.
That shortfall doesn’t go away – it is carried forward into future months. The rate of reduction must now be even faster to fulfil the government’s pledge to restore the 18-weeks standard. With that in mind, it was good to see the latest planning guidance cover the whole three years up to 2029, rather than just the coming financial year – reducing the risk that the NHS’s most intractable backlogs will be left until the last minute.
In the following discussion, all figures come from NHS England. You can look up your trust and its prospects for achieving the waiting time targets here.
The numbers
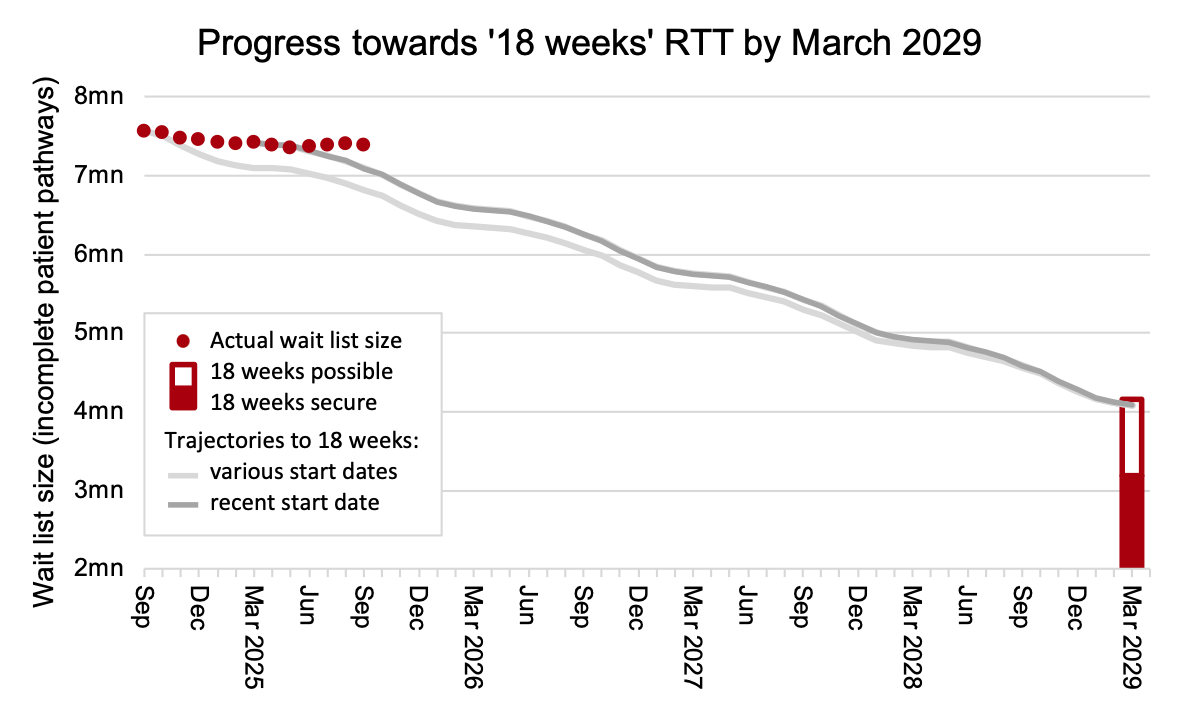
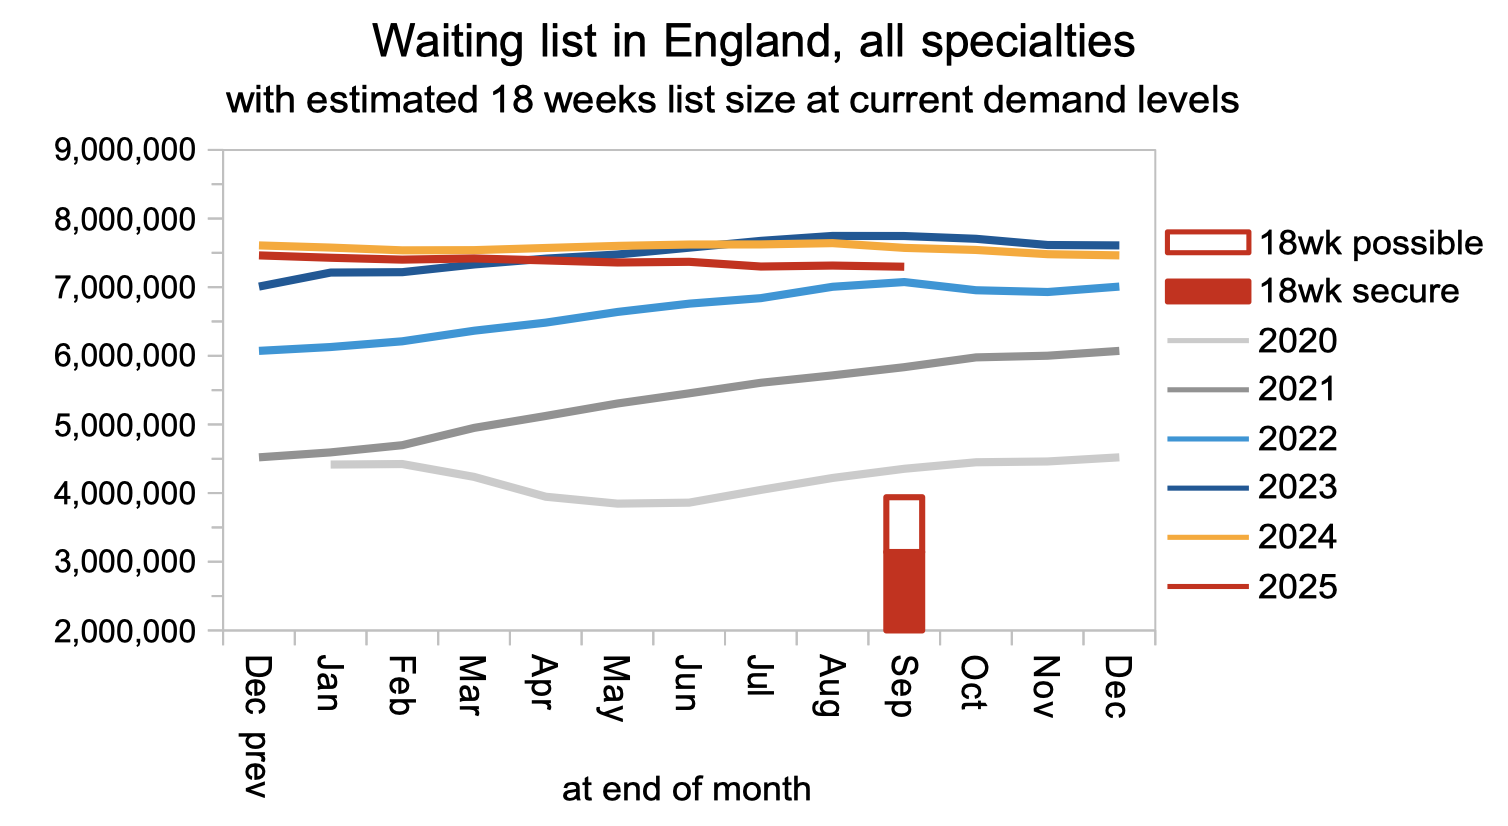
Adjusting for non-reporting trusts, the waiting list remained well away from the recovery trajectory consistent with restoring the ’18 weeks’ standard by March 2029, and the gap widened again in September.
The accumulated gap between the current trajectory, which started at the end of March, and the actual waiting list in September is 298,000 patient pathways. That gap will now be carried forward. When this chart is refreshed next month, it will show a new, steeper trajectory out to 2029. (See here for an explanation of the method.)
Waiting list reductions should currently be accelerating towards roughly one million pathways per year from March 2026, but (as the chart below shows) this has stalled. (Note that this and all subsequent charts are not adjusted for non-reporting trusts – a large teaching hospital has dropped out of the data from July).
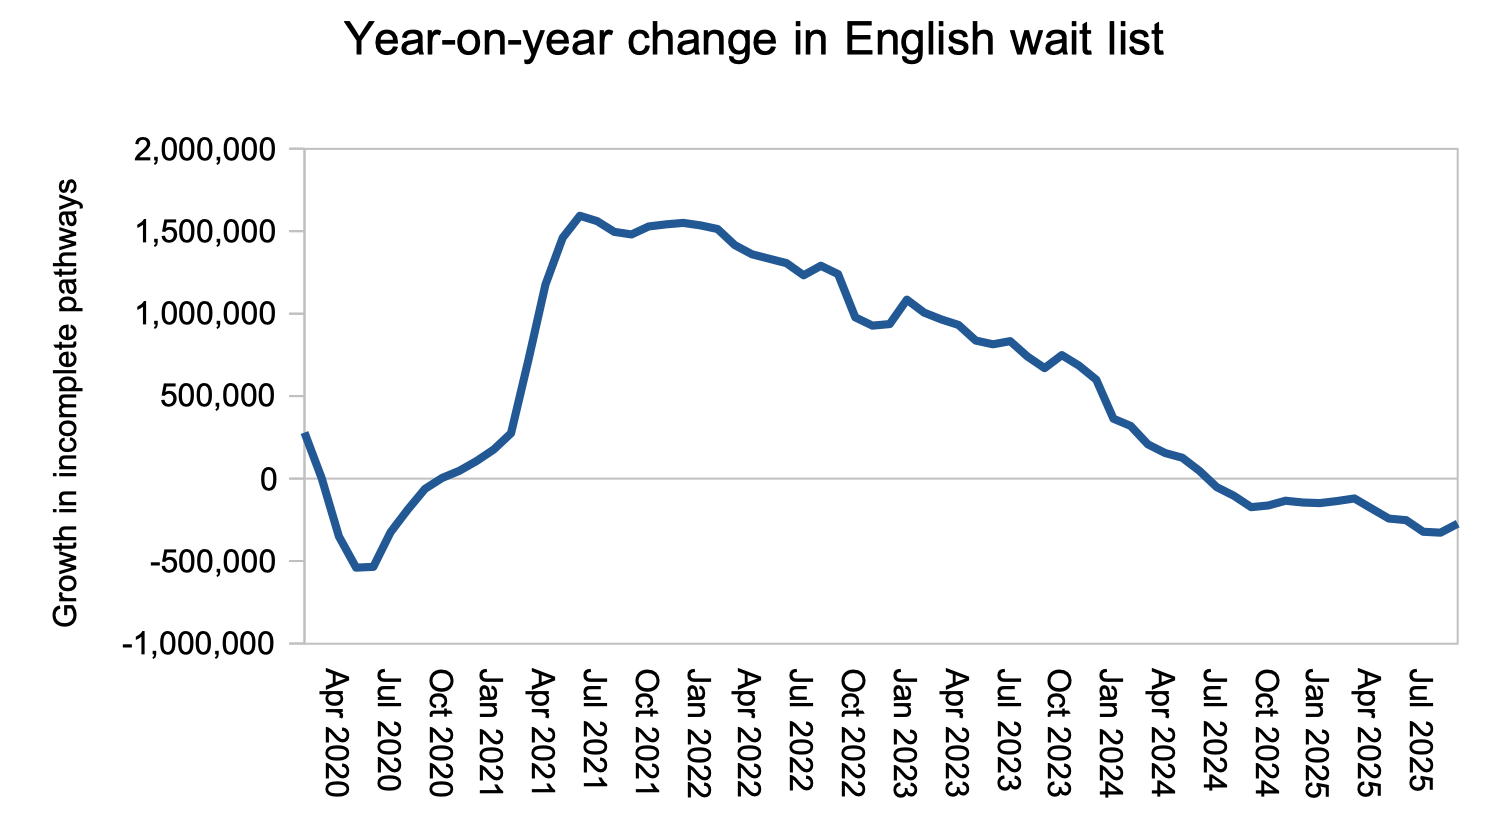
It is good that the rapid waiting list growth seen during the pandemic has come to an end. But the waiting list now needs to shrink decisively every single month, for the 18 weeks standard to be restored in 2029. Instead, it is roughly flatlining.
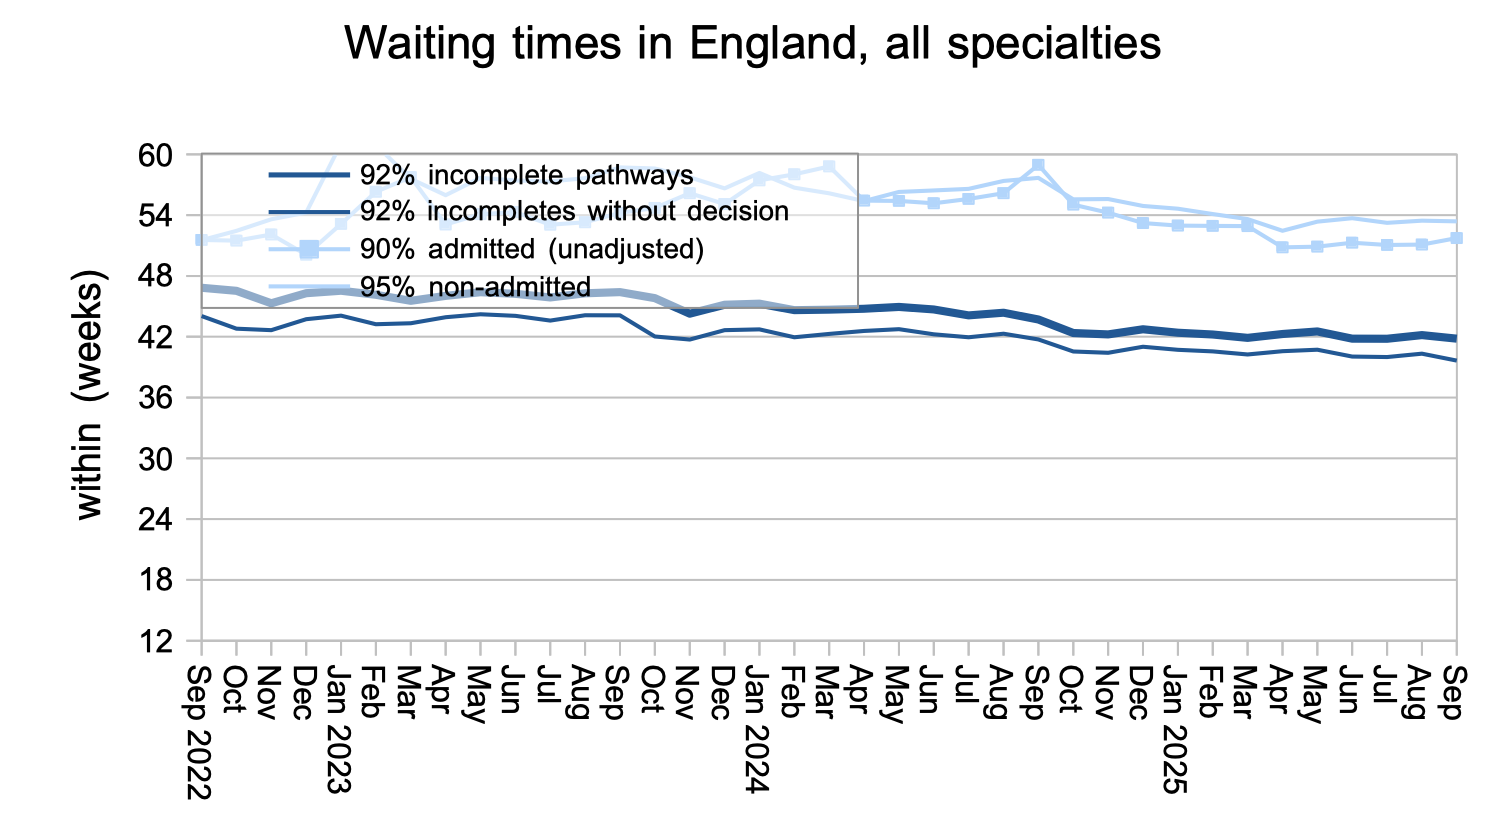
Waiting times (which are what matter to patients) reduced slightly by 0.3 weeks to 41.8 weeks RTT. For those patients who do not yet have a diagnosis and decision to admit, waiting times fell faster by 0.7 weeks to 39.6 weeks, which is still far too long if you are one of the estimated 26,601 of those patients whose eventual diagnosis will unexpectedly be cancer.
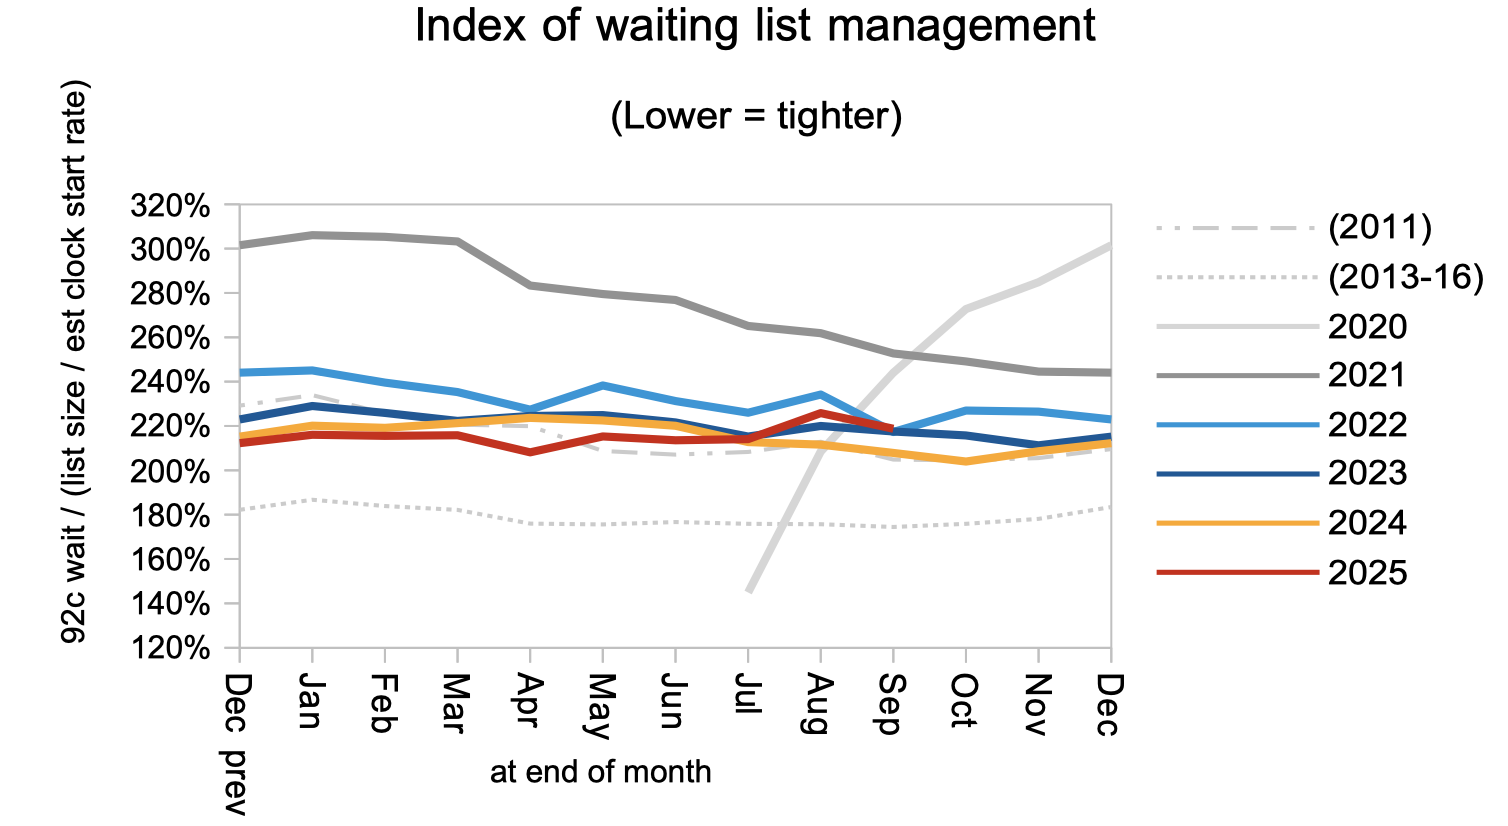
Waiting times are a function of both the size and shape of the waiting list, and the next chart is a measure of the shape. This remained worse than in 2011, which was just before the introduction of the ’92 per cent incomplete pathways’ target that removed a perverse incentive and shortened waiting times. The shape of the waiting list should improve as progress is made towards 18 weeks, but it could remain high if some trusts, specialties, or stages of treatment make slower progress than others.
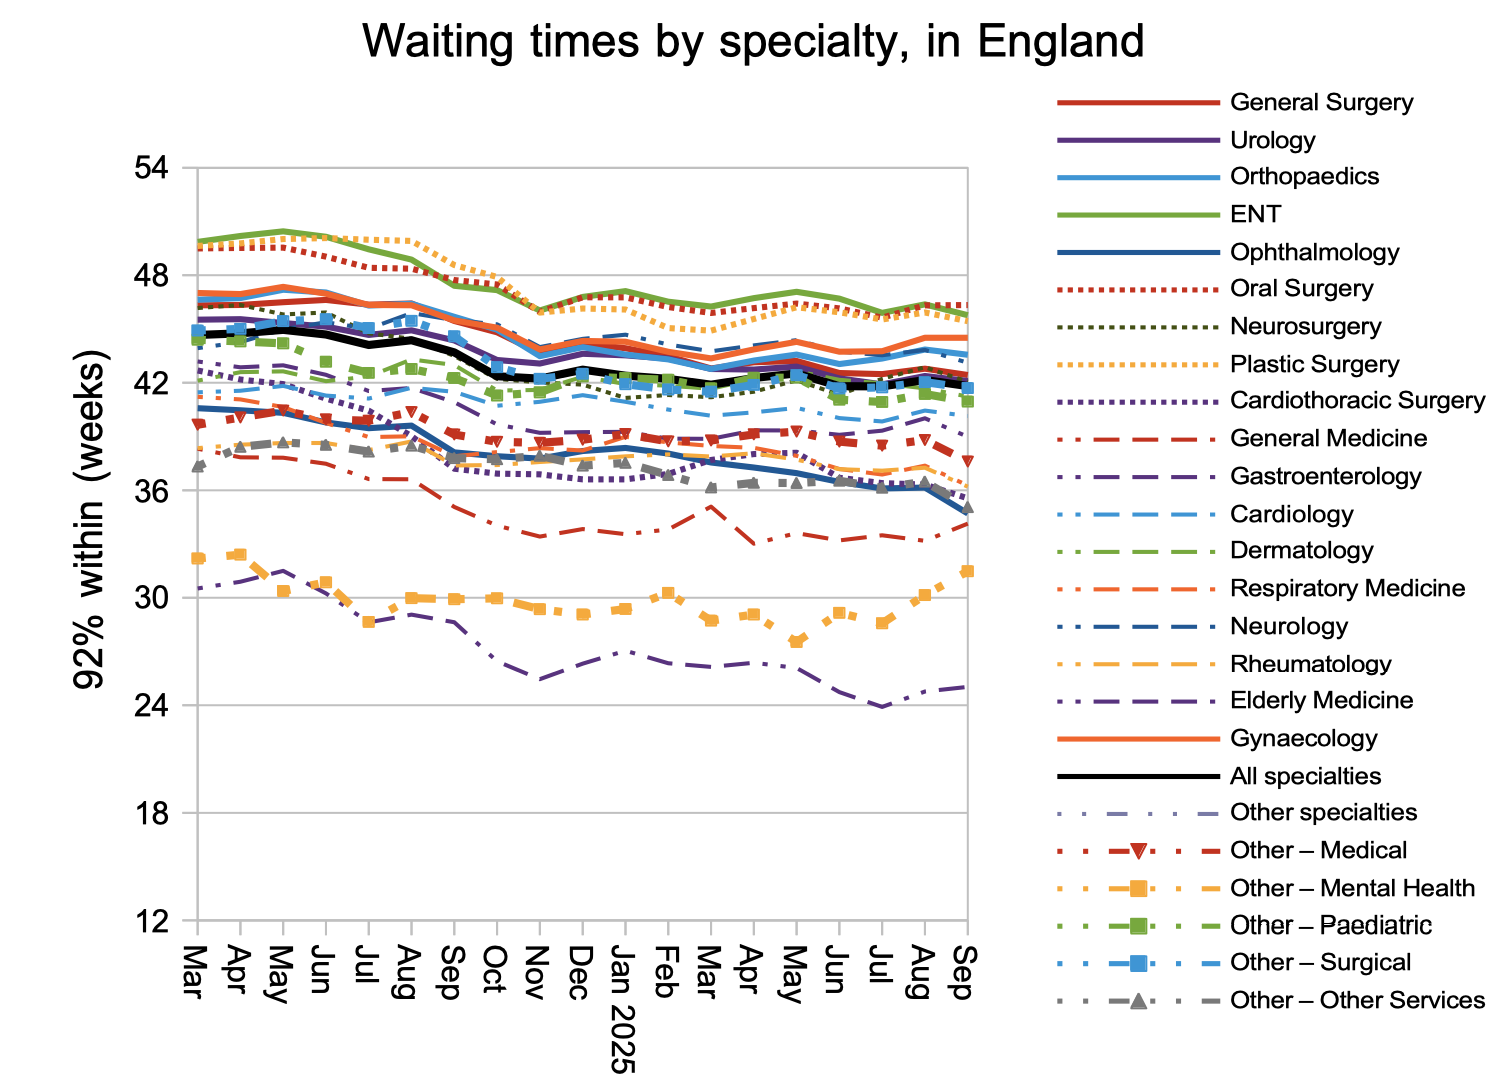
The overall picture on waiting times is mostly reflected in each specialty separately. Mental Health waiting times appear to be rising again, but this is difficult to interpret because reporting is patchy in this sector.
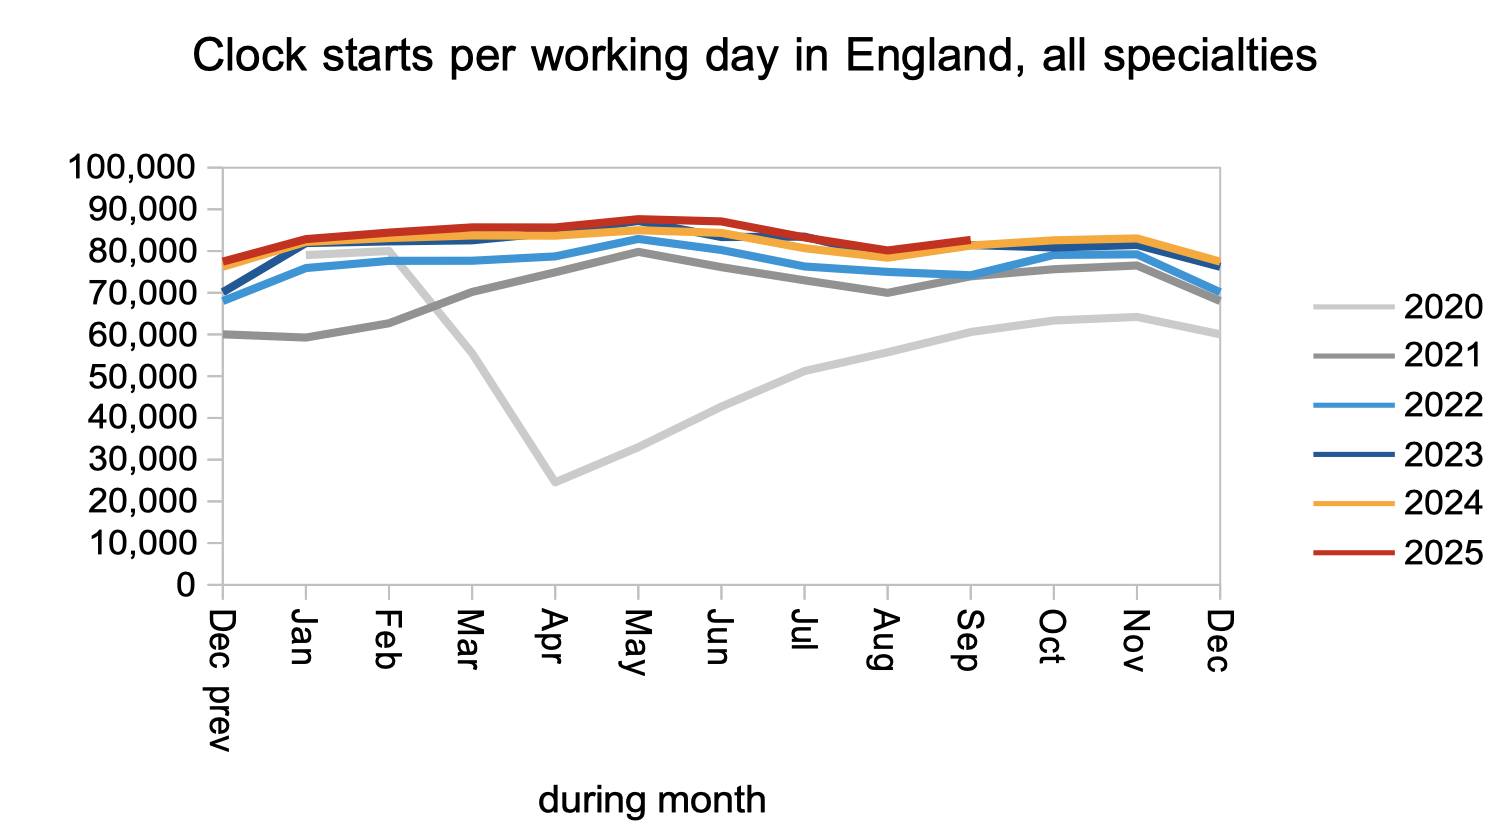
Waiting lists grow when patients are added to the list faster than they are removed. Patients were added to the list at broadly the same rate as last year, as shown by the numbers starting new waiting time ‘clocks’.
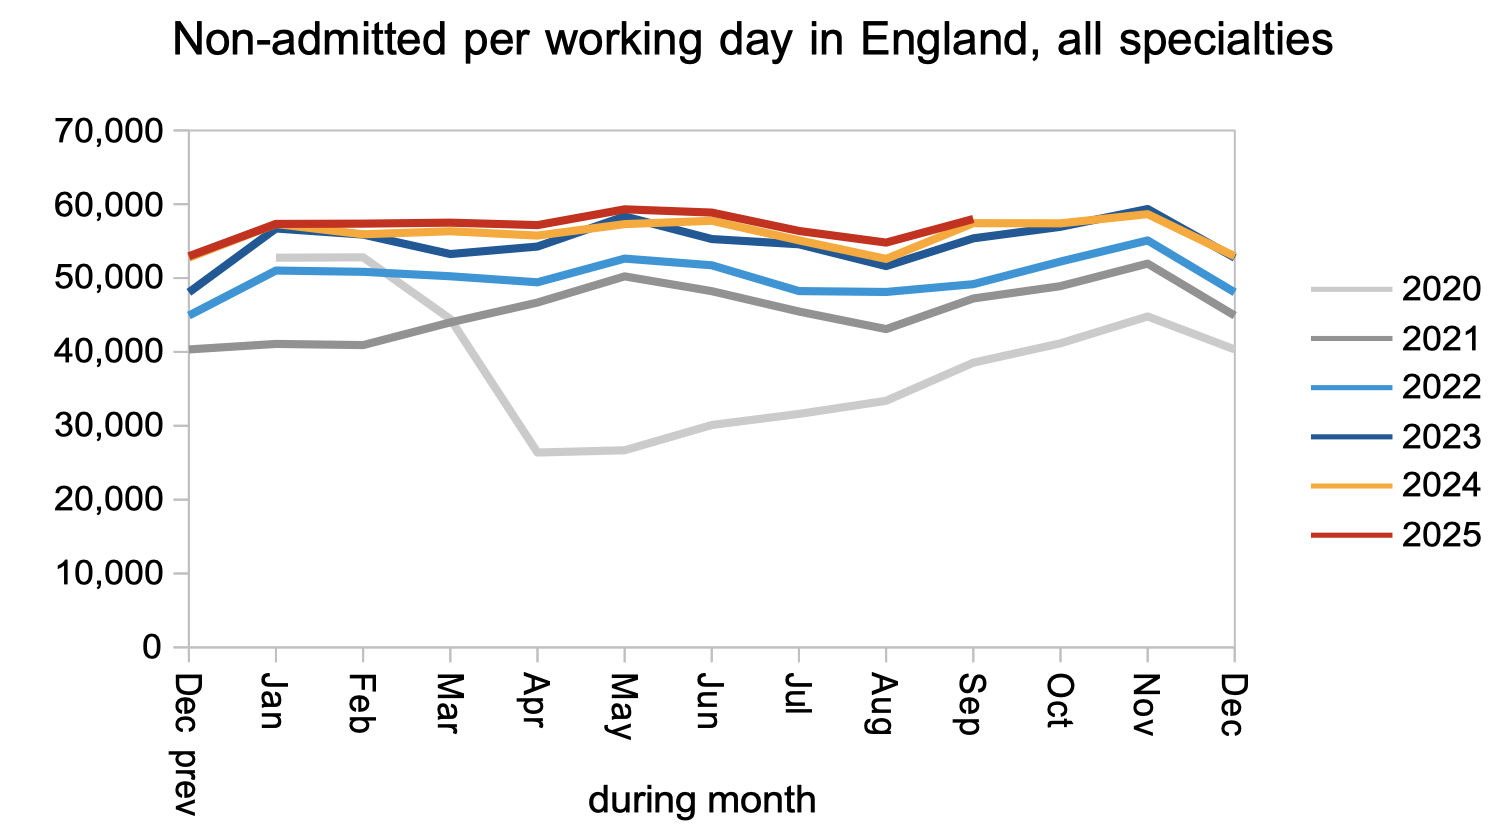
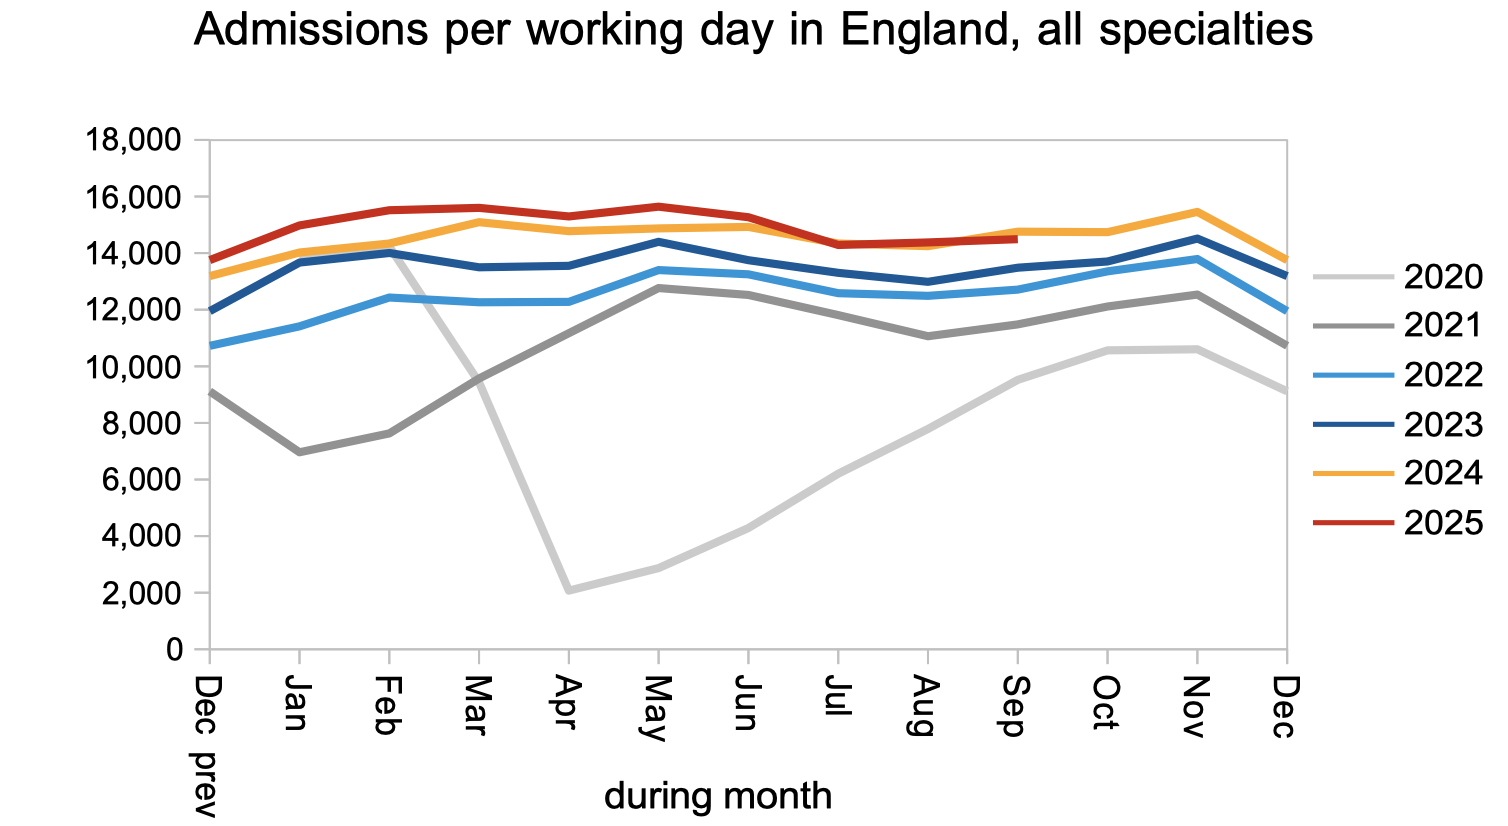
Removals from the waiting list happen in one of three ways: when the patient is admitted for inpatient or daycase treatment (an admitted clock stop); is discharged from outpatients or diagnostics (a non-admitted clock stop); or is removed administratively because they no longer require care or were found to be on the list in error (in which case they do not show up in the data).
Non-admitted clock stops also remained close to last year’s rate, and this in particular needs to increase so that patients reach diagnosis faster and the sheer numbers on the list reduce.
Finally, admitted clock stops also remained close to last year’s levels. As the NHS makes progress on outpatients and diagnostics, admissions will need to rise for those patients who turn out to need treatment.
Referral-to-treatment data up to the end of October is due out at 9:30am on Thursday 11th December.
Return to Post Index
Leave a Reply
You must be logged in to post a comment.