
England only weeks away from a national 52 week waiting times breach
16/03/2021by Rob Findlay
The statutory target is that 92 per cent of waiting list patients should be waiting less than 18 weeks since referral. It hasn’t been met since February 2016.
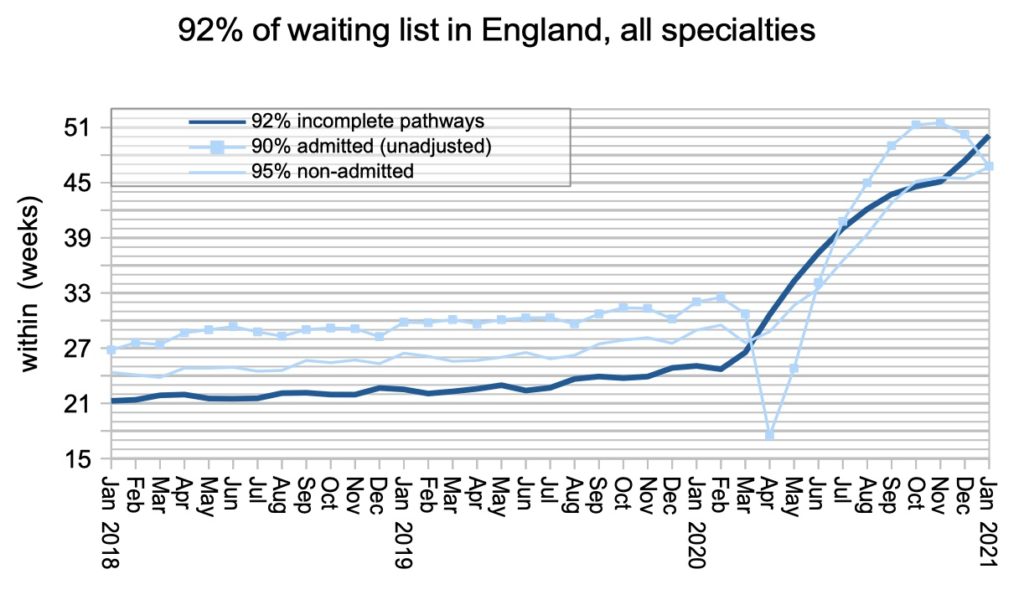
In January 2021, the English waiting list had reached 50.1 weeks. That’s 2.7 weeks higher than the previous month, and on the point of surging past the iconic 52 week mark.
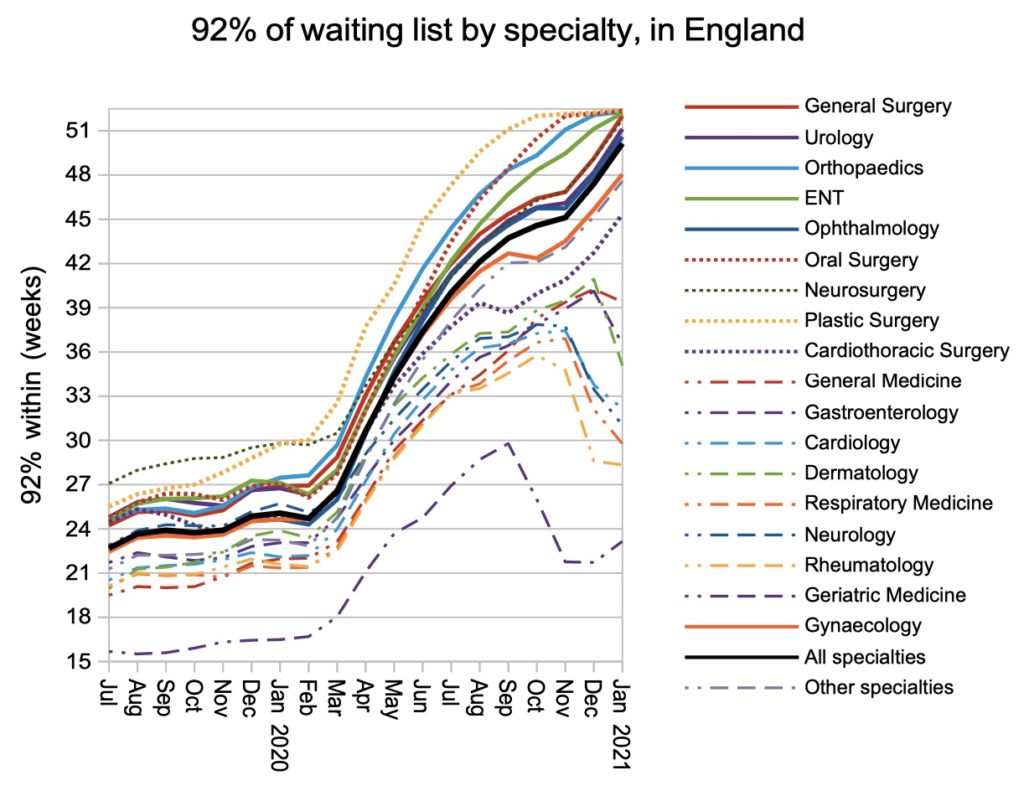
Five entire specialties already have waiting times longer than 52 weeks nationally. But how much longer are they? We don’t know. NHS England collect the statistics, but they don’t publish them. The published data stops at “52 plus”.
It is a matter of legitimate public interest how long waiting times really are, because the greatest harms lie at the extremes. If waiting times in a particular local service extend to 104 weeks and beyond, it is misleading to classify them as “52 plus”, and it obscures the risks and harms that these ultra long waiting patients are exposed to and suffering.
And these are not the only risks and harms that are invisible in the current published data. Clinicians are rightly concerned about their delayed urgent patients, delayed follow-ups, and those patients whose urgent clinical conditions are first detected in routine outpatient appointments after an excessive delay.
We need to shine light on these risks and harms, so that priorities can be set and plans drawn up to deal with them. Publishing better data is the first step.
In the following discussion, all figures come from NHS England and NHS Improvement. If you have a national statistic that you’d like to check up on, you can download our waiting times fact checker.
For analysis of waiting times performance at a particular organisation, visit our reports page, or our map of the latest RTT waiting times across England.
England-wide picture
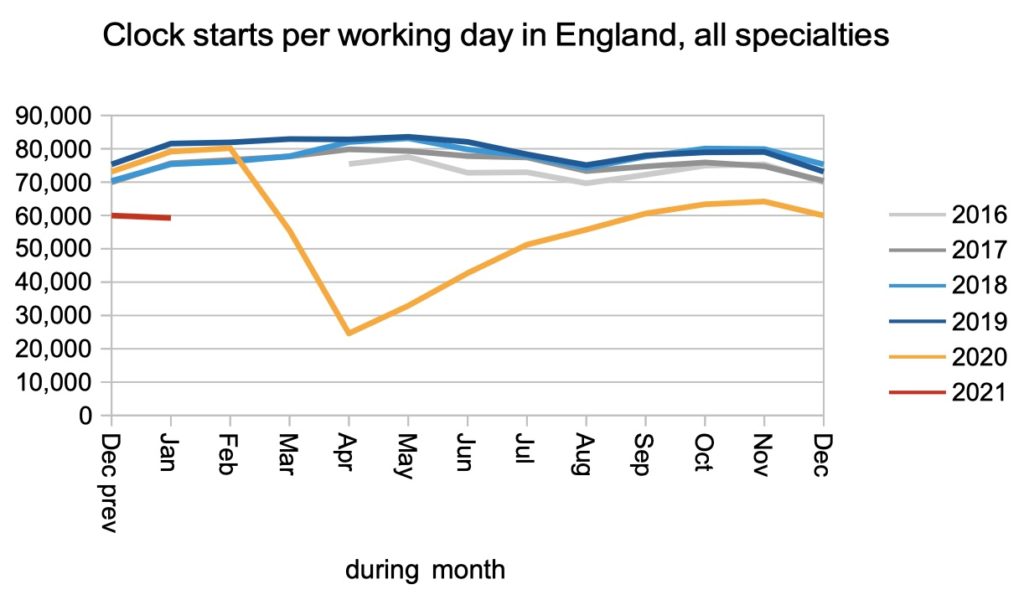
Referrals (which lead to RTT clocks being started) remained well below pre-covid levels, which suggests that the hidden backlog of pent-up demand is continuing to grow.
Those patients, who have been avoiding their GPs during covid, can be expected to start returning in the coming months. When that happens, clock starts are expected to rise above the level of recent years.
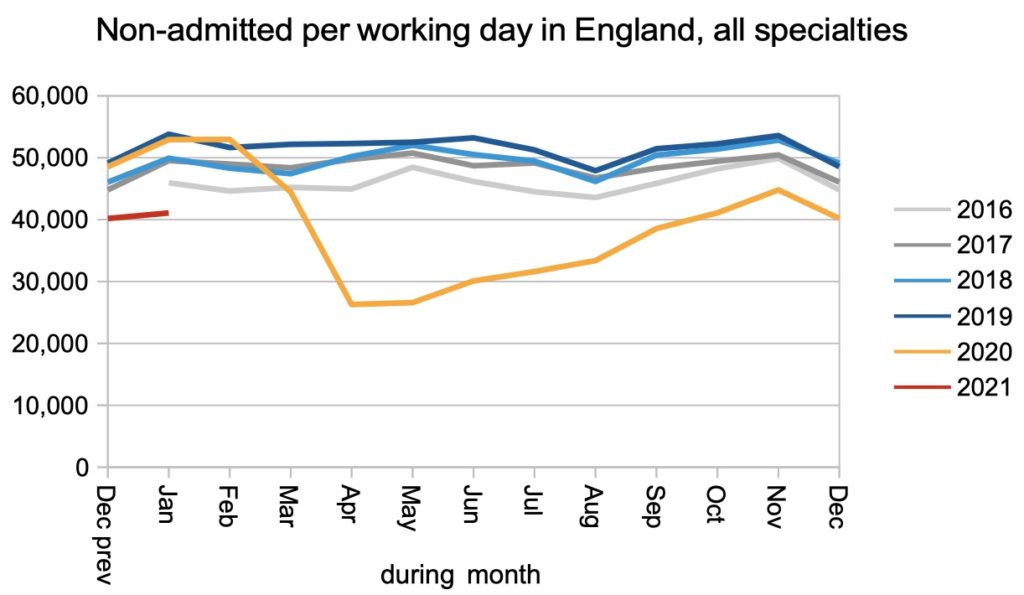
The number of patients being discharged without admission (broadly, those patients discharged following an outpatient appointment or procedure, or for administrative reasons) also remained significantly below pre-covid levels.
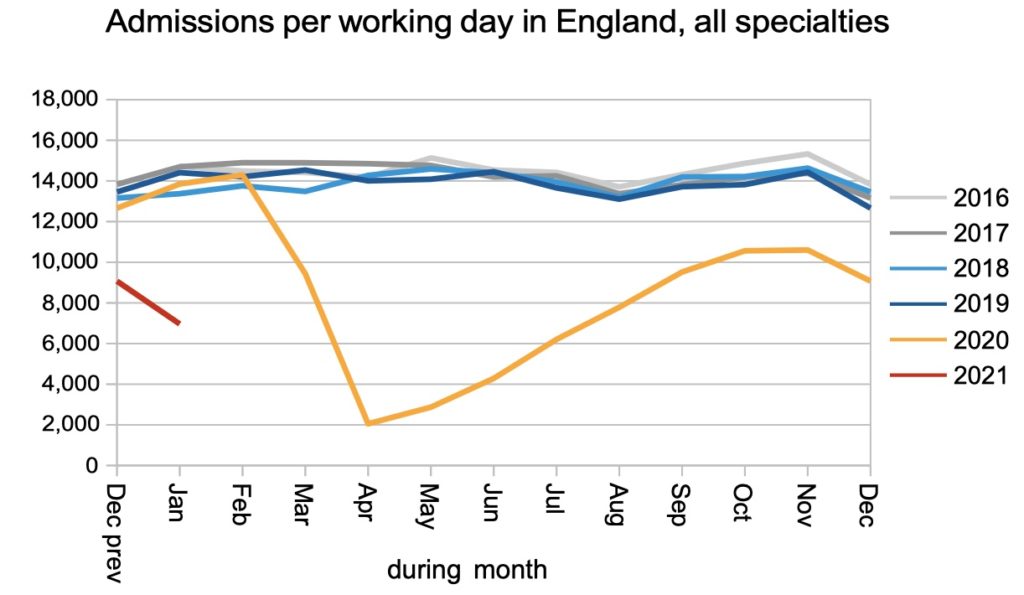
Admissions for inpatient and daycase treatment dropped dramatically in January, as the NHS struggled with high covid admission rates and ongoing covid restrictions.
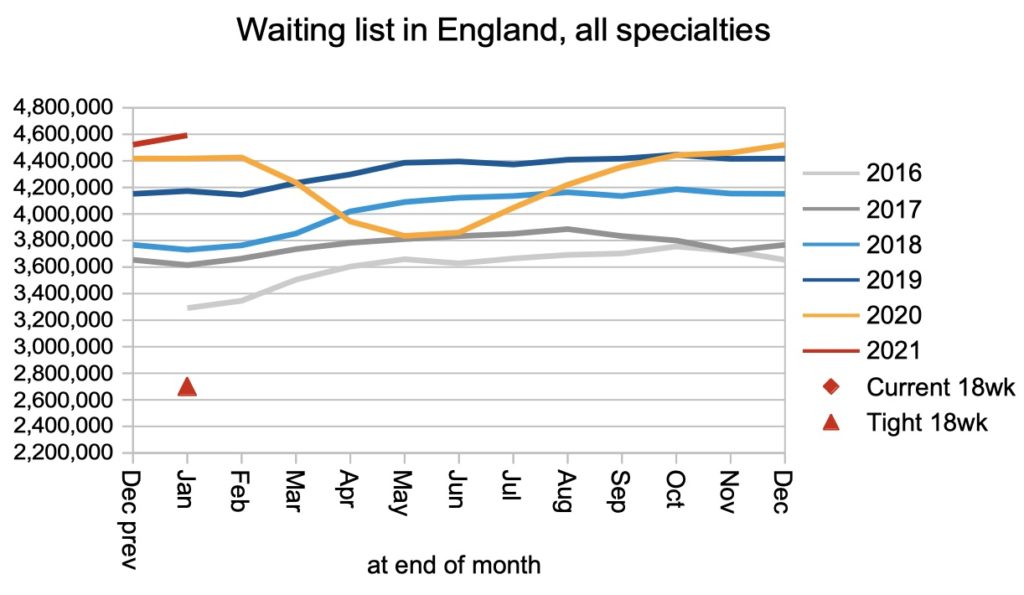
The net result of fewer clock starts, and fewer clock stops, was a waiting list that grew slightly. However this picture omits the hidden backlog of pent-up demand that has built up during covid as patients stayed away.
Waiting times shot up by 2.7 weeks during January – the fastest monthly rate since June in the first covid wave. At the end of January they stood at 50.1 weeks, so we can expect the iconic 52 week mark to be passed during February or March.
At the end of December, three specialties – Orthopaedics, Oral Surgery and Plastic Surgery – had national waiting times over 52 weeks. In January, two more specialties joined them: General Surgery and ENT.
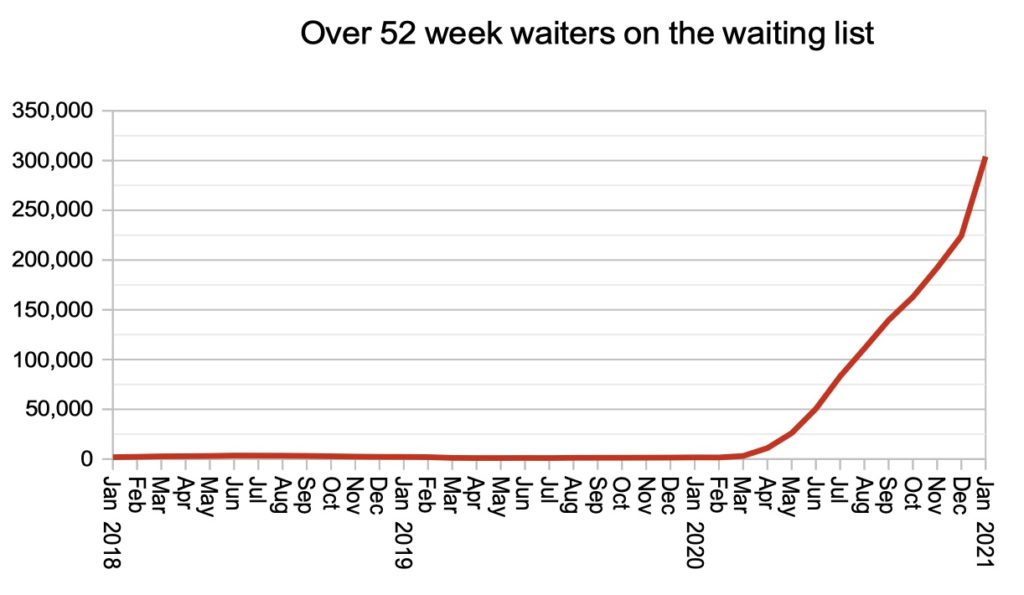
The number that gets all the press attention is the count of 52-week waiters, shown below. I argue that this is not a very useful number, because it doesn’t tell patients how long they might wait, only how many other people are in the same boat. But then the RTT data is getting less and less useful anyway, as more patients tip over into ’52 plus’, so we have to get our insights where we can.
Local picture
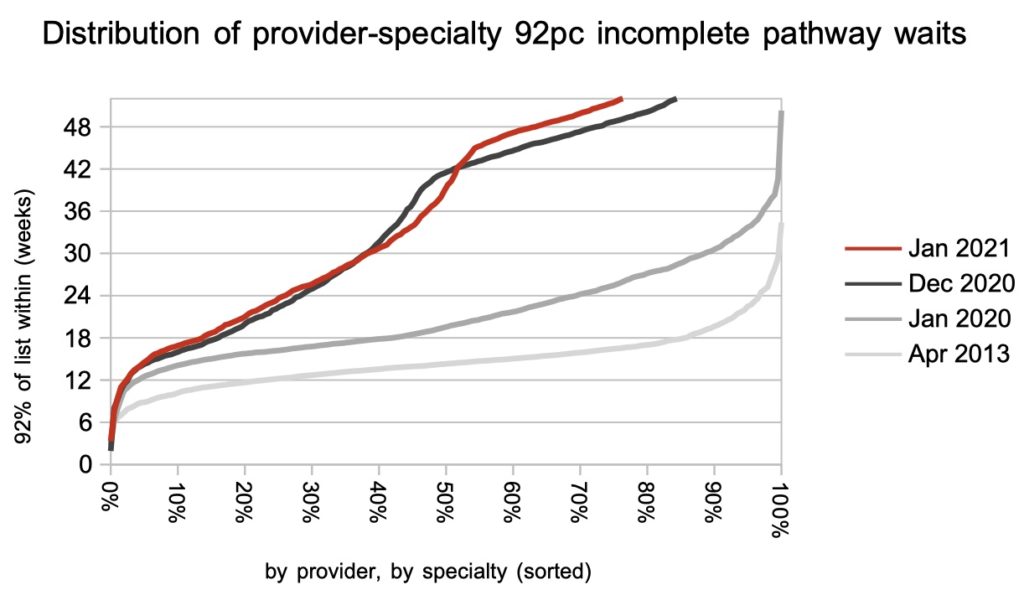
Looking at the thousands of specialty-level services within individual providers, around a quarter of these local services have reached the “52 plus” week wait category.
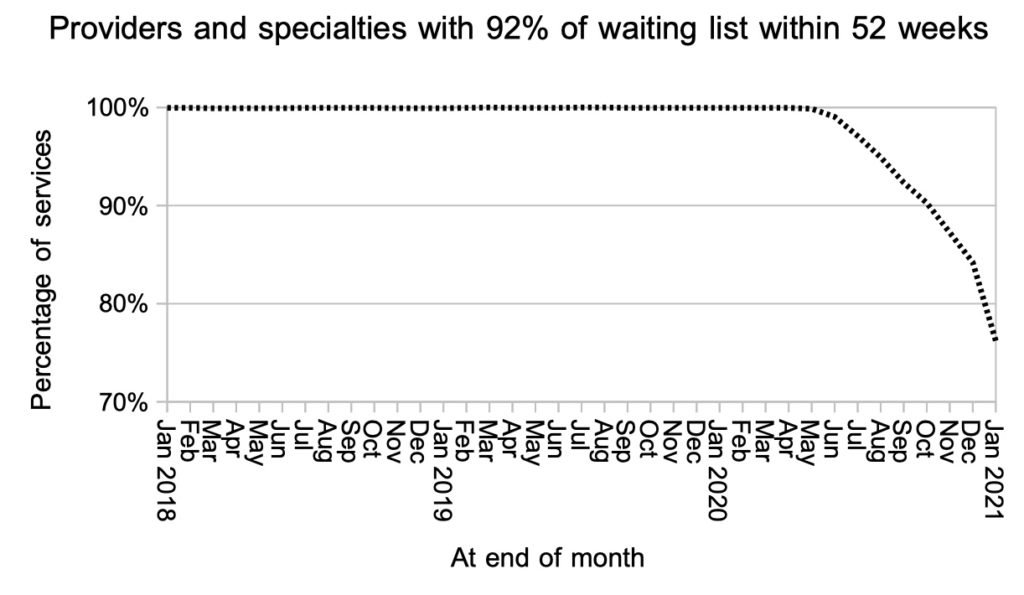
Although it is easy to be drawn to the heavy, recent lines in the next chart, please take a moment to look at the April 2013 position. As a nation, we did that once, and if we choose, we can do it again.
Referral-to-treatment data for February 2021 is due out at 9:30am on Thursday 15th April 2021. Which is the third Thursday of the month, not the usual second Thursday, and then it will be back to the normal schedule in May.
Return to Post Index
Leave a Reply
You must be logged in to post a comment.