
Waiting list grows for third consecutive month
14/10/2025by Rob Findlay
The English referral-to-treatment (RTT) waiting list grew by 12,000 patient pathways in August, whereas it should have shrunk by 67,000 to restore the statutory ’18 weeks’ standard by March 2029 as the government has pledged.
A growing waiting list is not consistent with the timely restoration of 18 week waits, regardless of seasonal variations. Consider a steady-state scenario where the waiting list neither grows nor shrinks through the annual cycle: it would typically grow by around 170,000 pathways from January to August, before shrinking back to its starting point the following January. But that seasonality is overwhelmed by the need to cut the waiting list year-on-year to restore 18 week waits. Any growth in the waiting list, regardless of the month, is off track.
To make matters worse, this is the third consecutive month of waiting list growth. They follow a couple of months of shrinkage, but even those might be explained by a major ‘validation’ exercise to remove erroneous pathways. At the end of August the waiting list was some 230,000 pathways larger than it would have been, had it stayed on track this financial year.
You will not be surprised to learn that NHS England’s news release does not dwell on these dismal results, focusing instead on activity reaching record levels.
In the following discussion, all figures come from NHS England. You can look up your trust and its prospects for achieving the waiting time targets here.
The numbers
The current trajectory towards restoring 18 week waits (the dark grey line) started with this financial year, and the latest waiting list size (the right-most red dot) was 230,000 patient pathways bigger at the end of August. The trajectory drops by 67,000 in August, compared with a rise of 12,000 in the actual waiting list over the same month. The method is fully explained here.
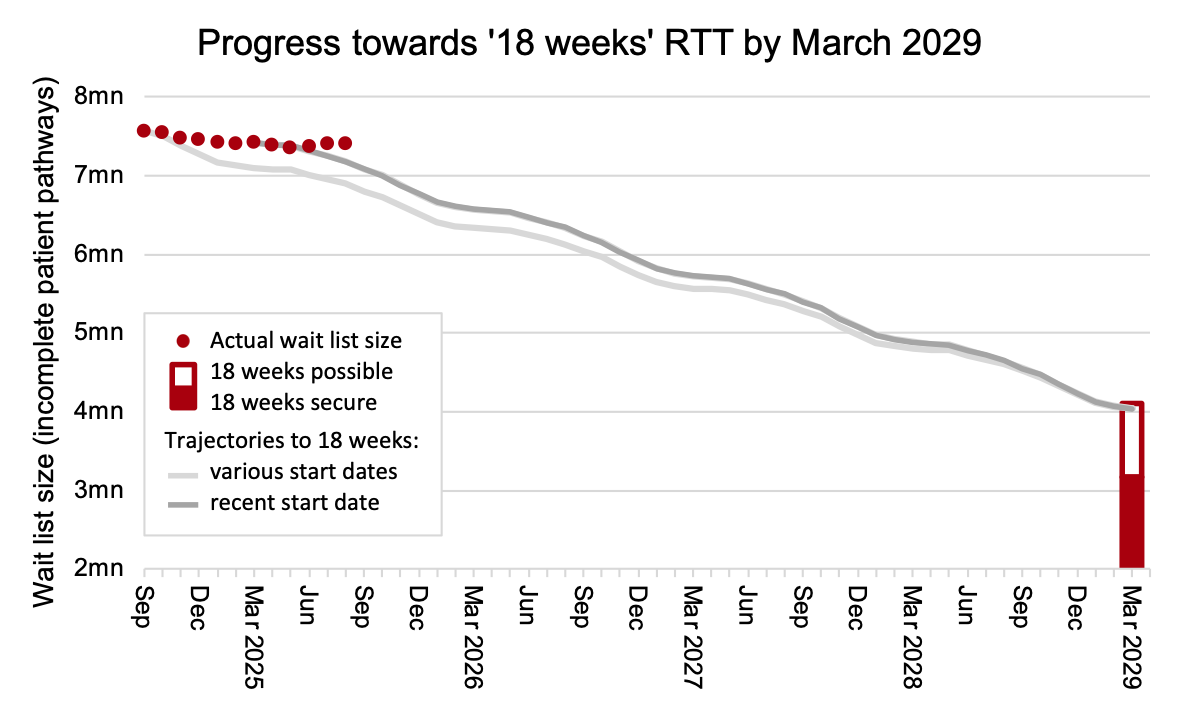
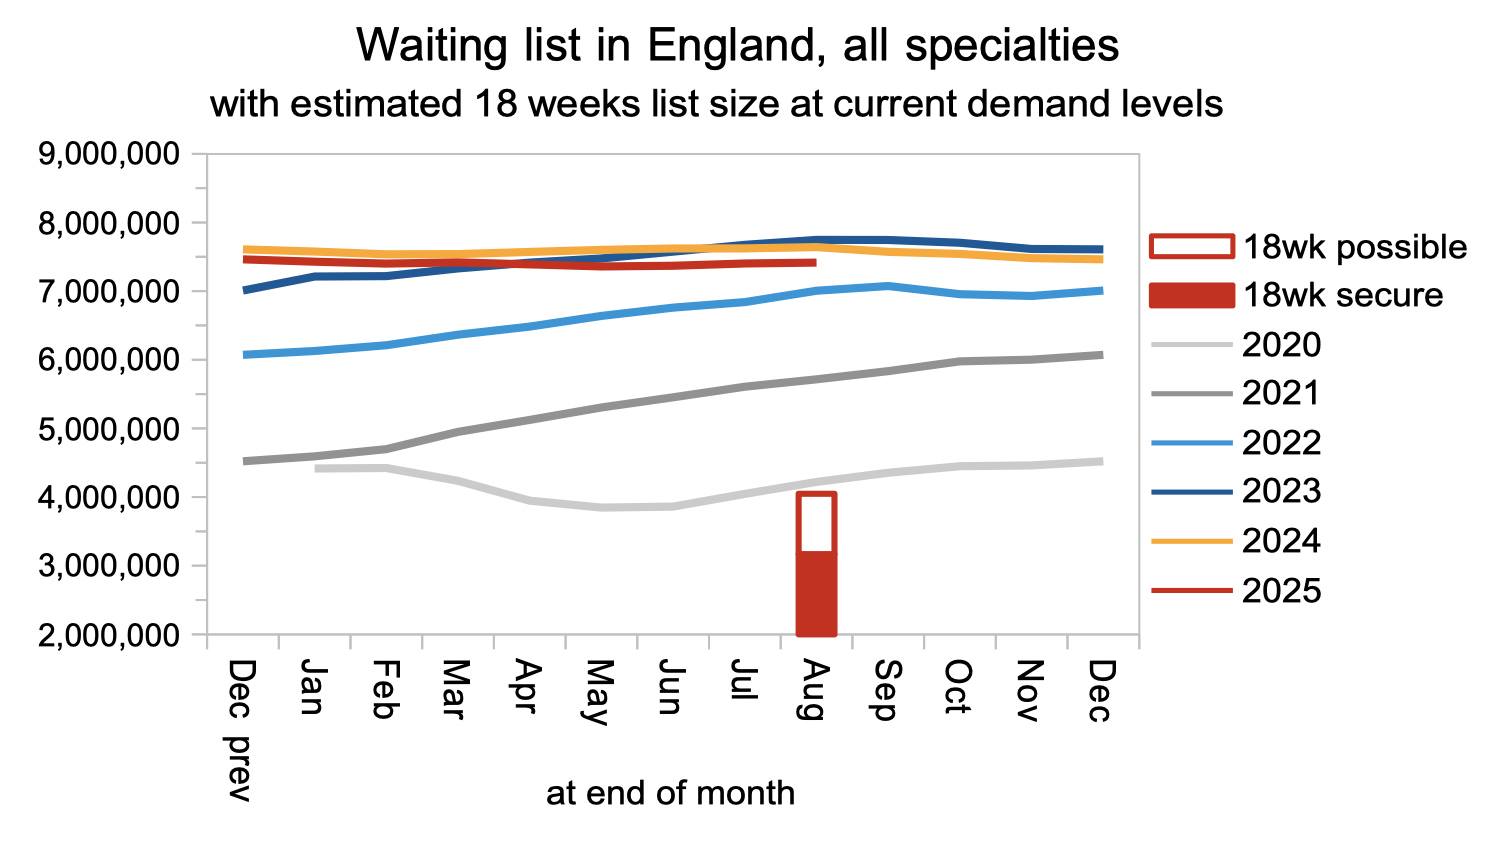
The waiting list size has been falling year-on-year, but not nearly fast enough to restore 18 week waits in 2029.
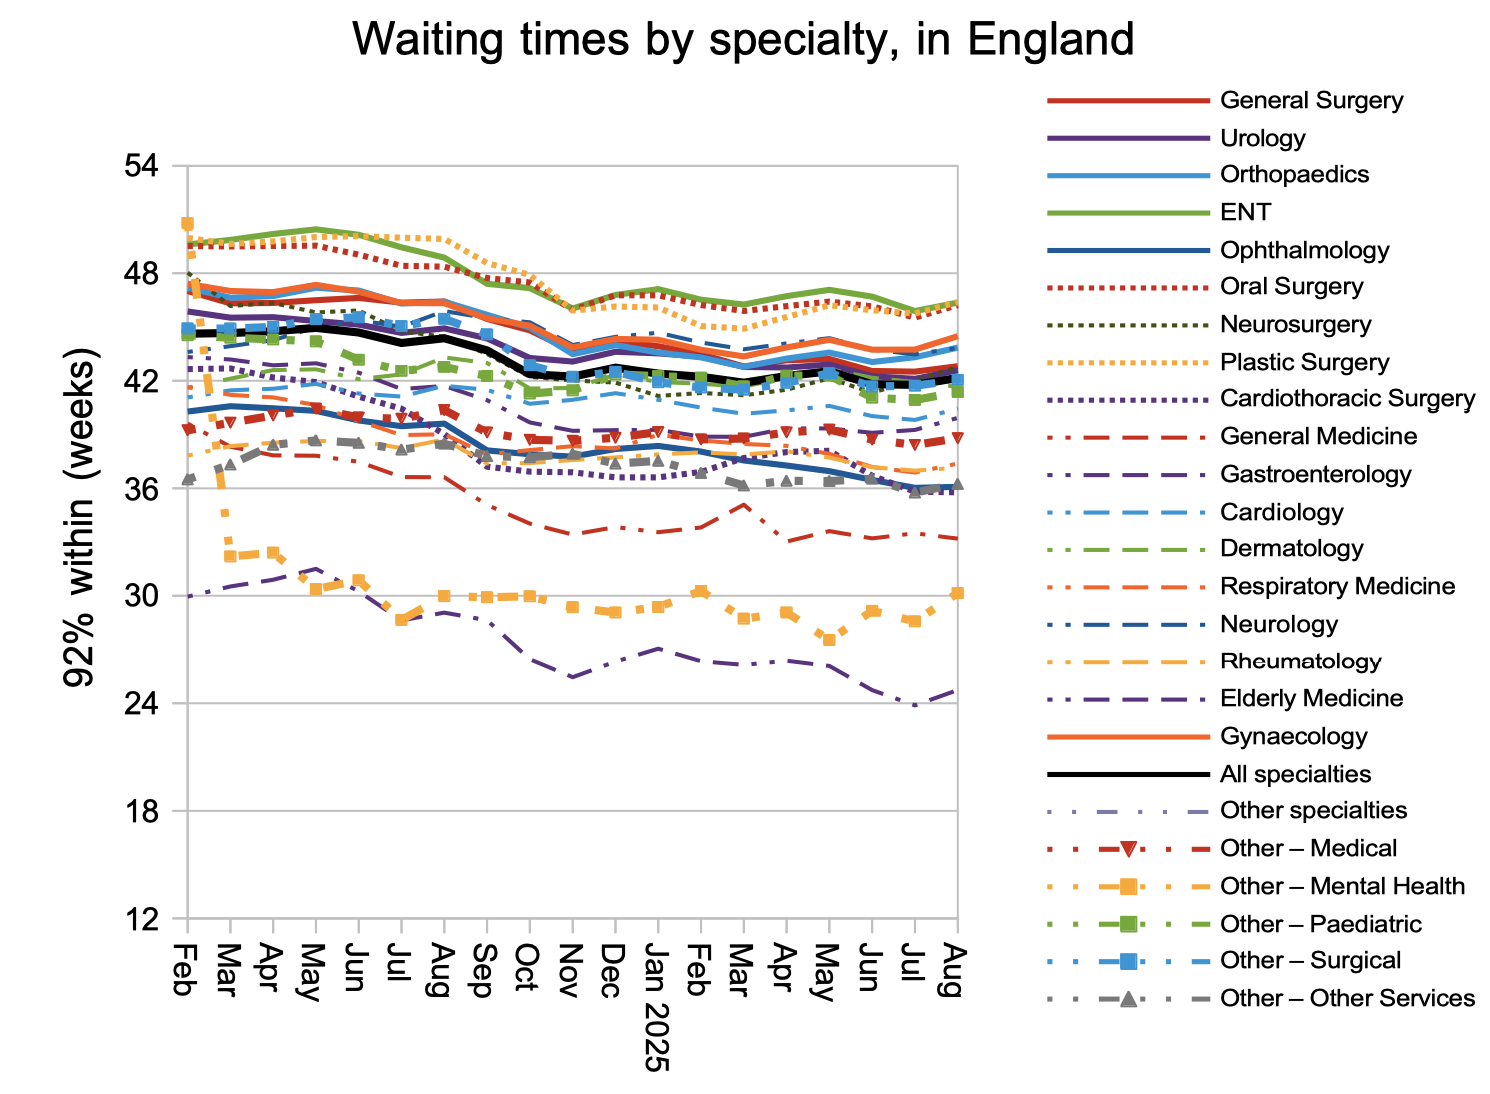
Waiting times edged higher in August, by 0.4 weeks to 42.2 weeks RTT.
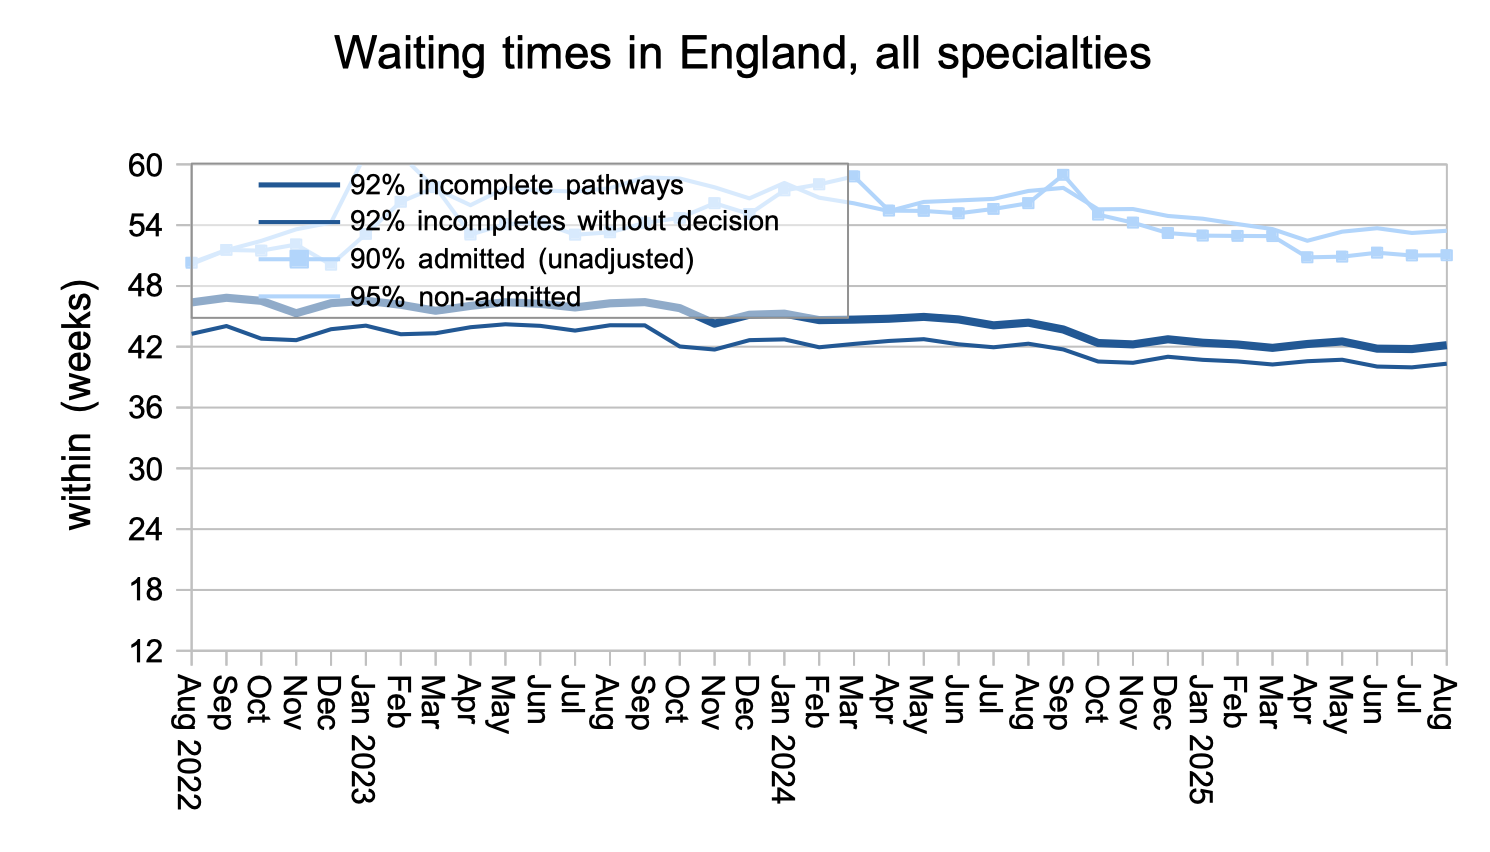
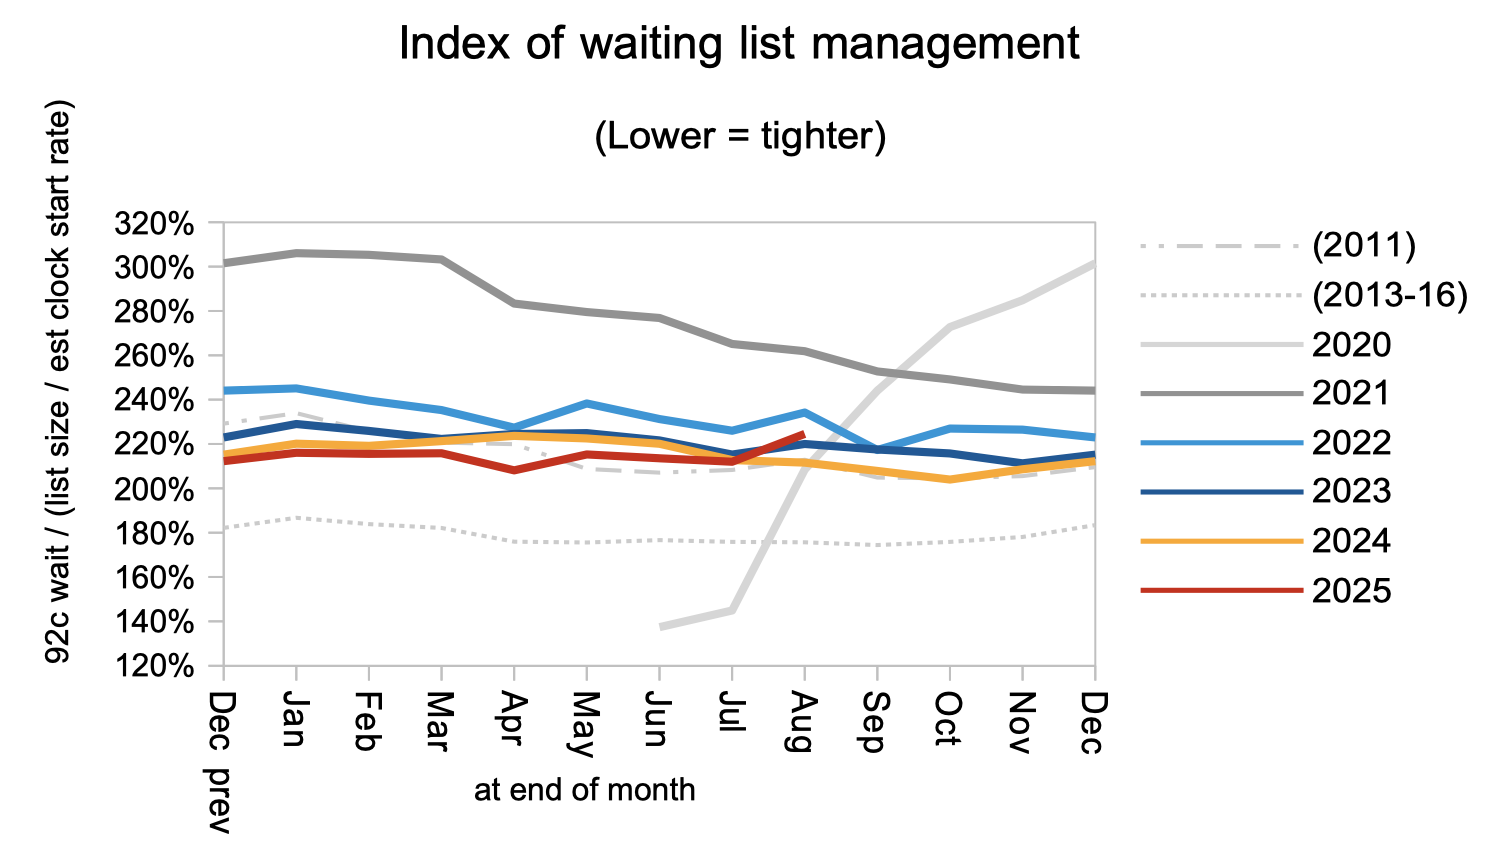
Waiting times are a function of both the size and shape of the waiting list. The shape is summarised in the next chart, and remains significantly higher (i.e. worse because it is longer-tailed) than in the best years from 2013-16. We can expect it to improve (i.e. reduce) naturally as the 18 week standard is restored. And it had better, because if it doesn’t then the waiting list size would need to fall much further towards the ’18 weeks secure’ zone in the first chart above to achieve 18 week waits.
The uptick in waiting times was seen broadly across the specialties.
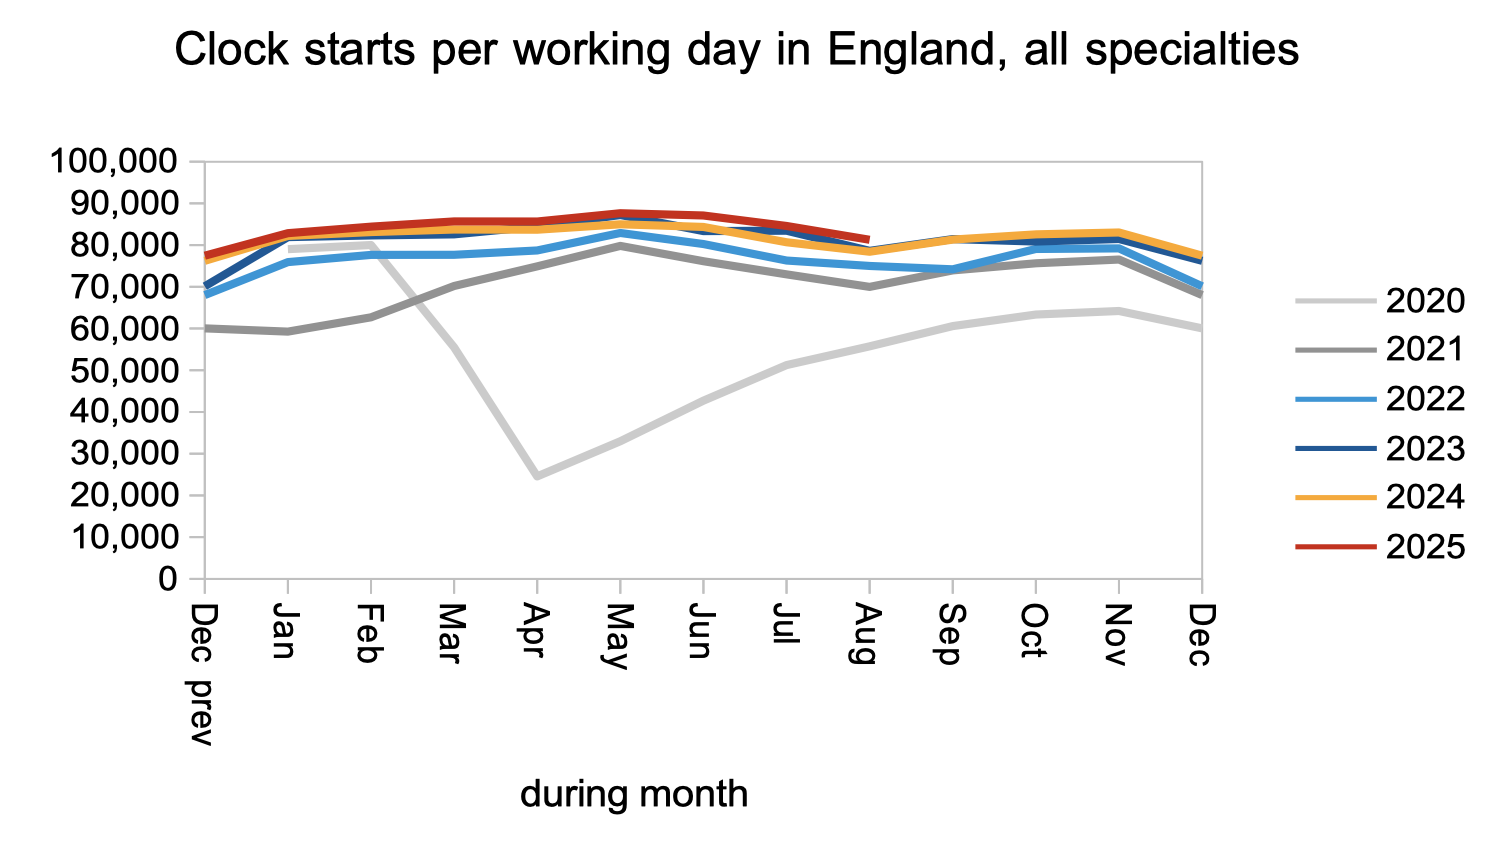
Waiting lists grow when activity and other removals are falling short of the demand for elective care. Unfortunately the official statistics do not count all of those things separately, but we can gain some understanding by looking at the trends for things that are counted. In the next chart we can see that demand, in the form of clock starts, remained slightly higher than in recent years.
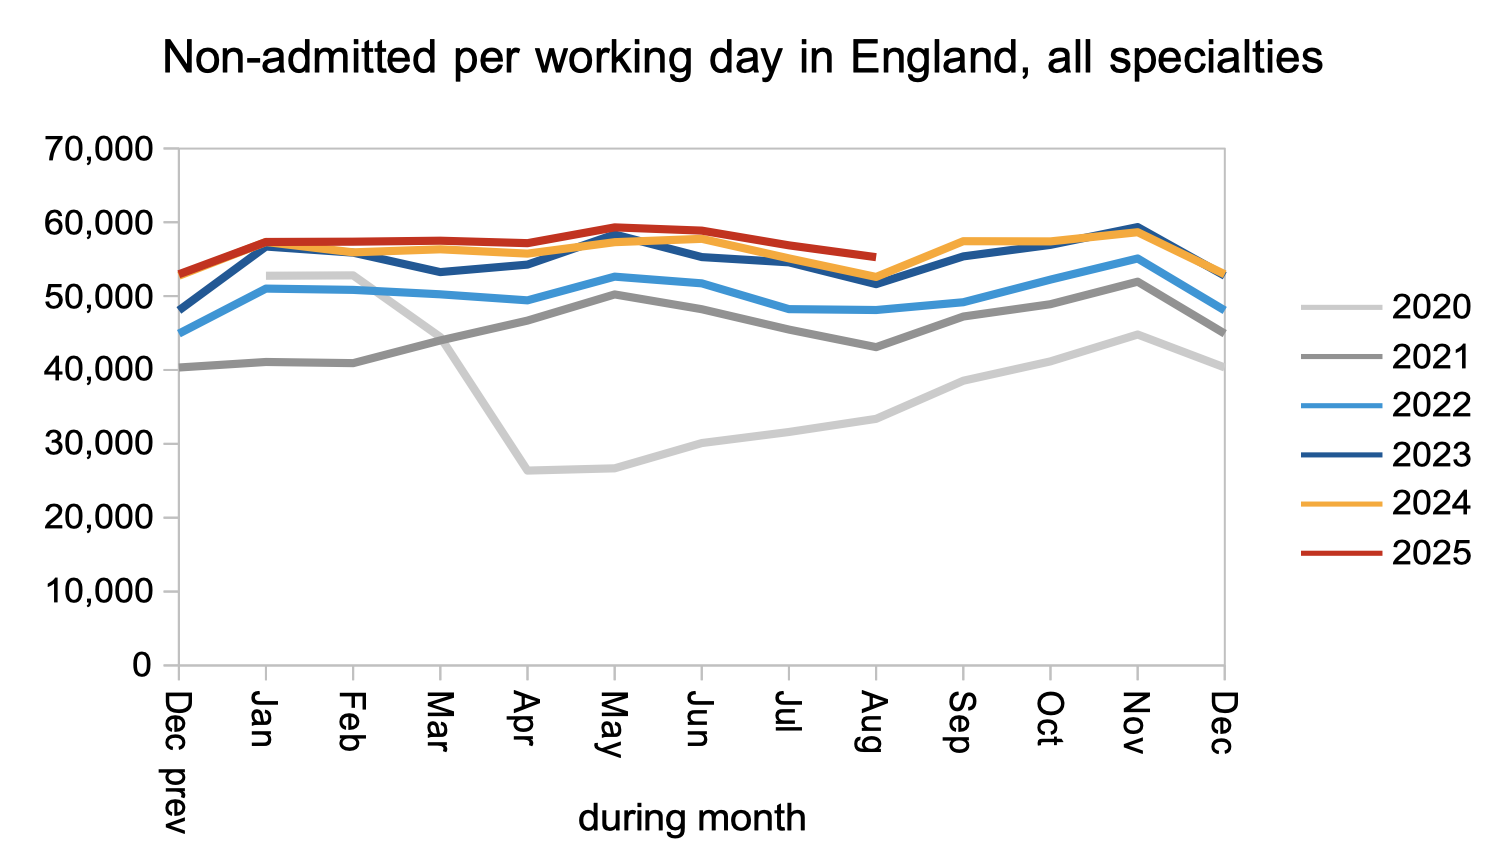
Non-admitted clock stops, which represent patients discharged from outpatients and diagnostics, were noticeably higher than in previous Augusts. This is good, but more is needed.
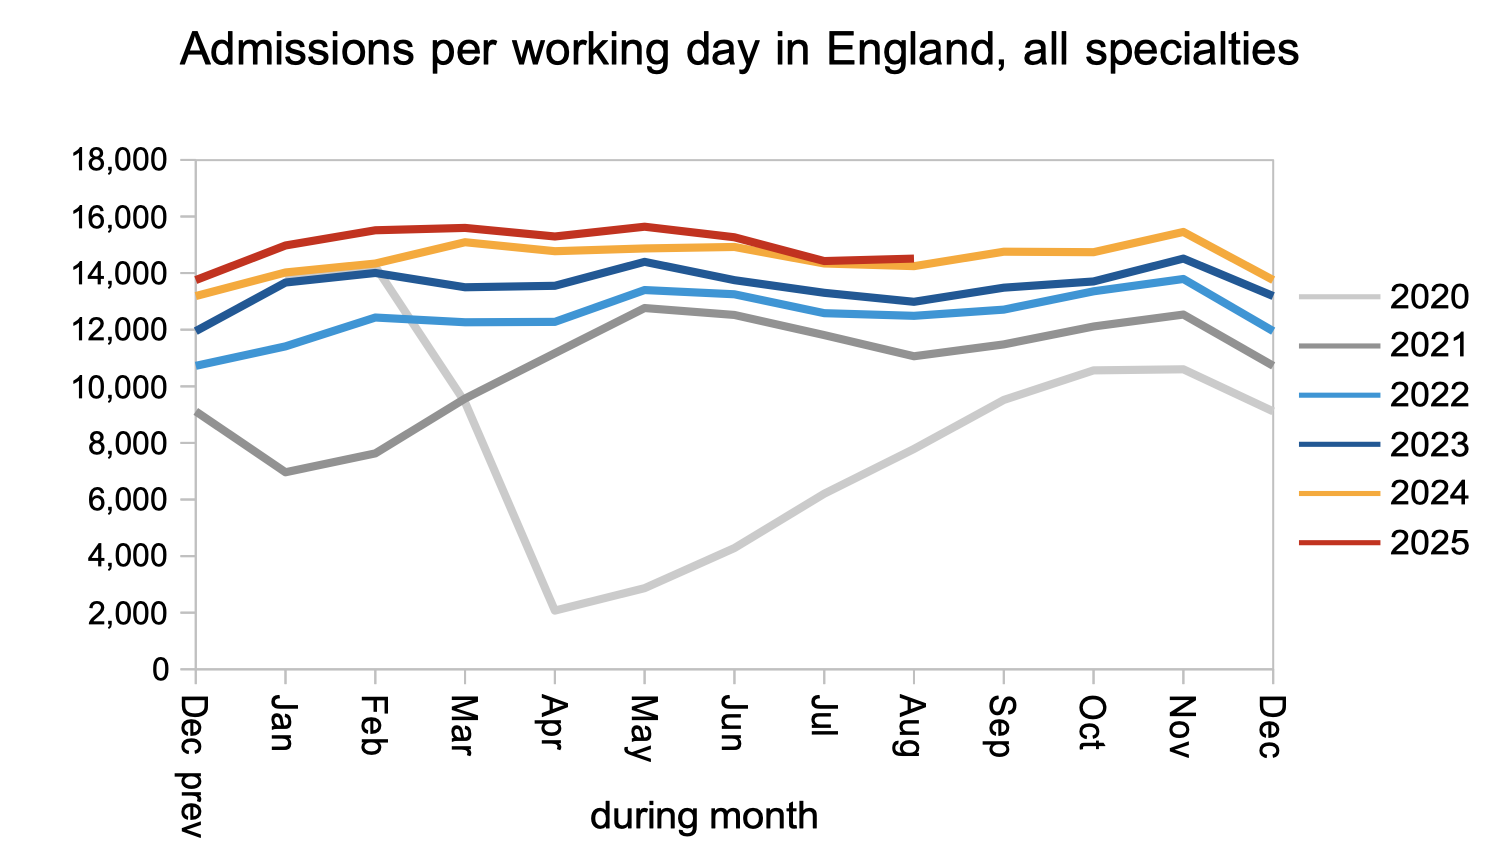
Admitted clock stops, where patients complete their elective pathways with an inpatient or daycase admission, were slightly higher than last year.
Referral-to-treatment data up to the end of September is due out at 9:30am on Thursday 13th November.
Return to Post Index
Leave a Reply
You must be logged in to post a comment.