English waiting times step back from the brink
16/06/2014by Rob Findlay
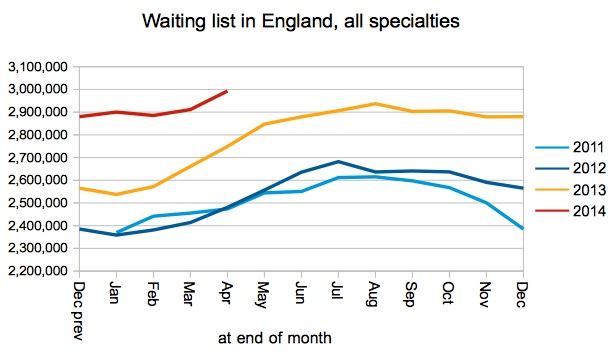
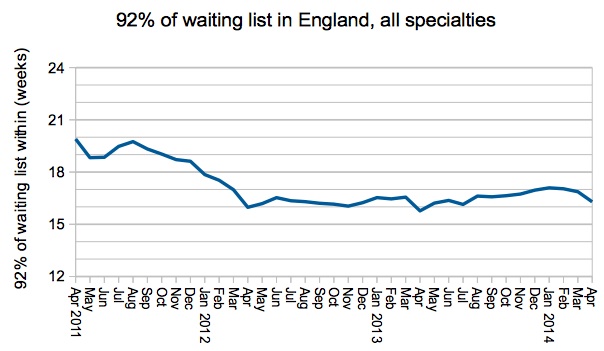
By the barest of margins, the English waiting list managed to limbo under the 3 million mark in April (2,993,108 on the official figures) and restored its performance against the ’90 per cent admitted’ target (at a bar-rattling 90.04 per cent). More importantly, it improved the long-waiting end of the waiting list, and in a single month recovered most of the slowly-lost ground of the last year against the ’92 per cent of the waiting list’ target.
As noted in the last couple of months, the official list size would already have passed 3 million if all Trusts were submitting their figures. In April, six Trusts did not report (mainly because of problems with new IT systems).
In the following analysis, all figures come from NHS England. If you have a national statistic that you’d like to check up on, you can download our Gooroo NHS waiting times fact checker
England-wide picture
The waiting list grew by a typical amount for the time of year, and scraped in just below the 3 million mark at 2,993,108 (not including six Trusts who did not report, and would definitely have pushed the numbers well above 3 million).
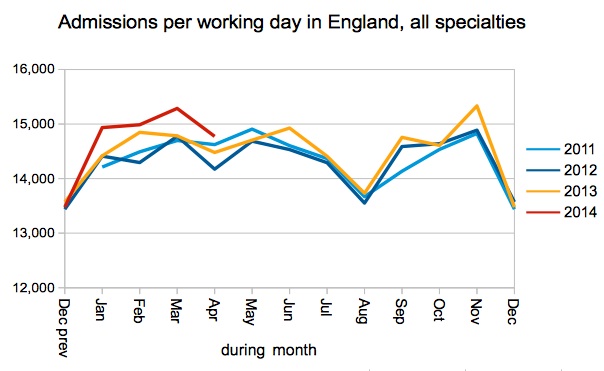
After a year-end surge in March, admission rates in April fell back closer to normal levels.
There wasn’t much movement on long waits; not that the one-year-waits figure is really trustworthy with so many Trusts not reporting data.
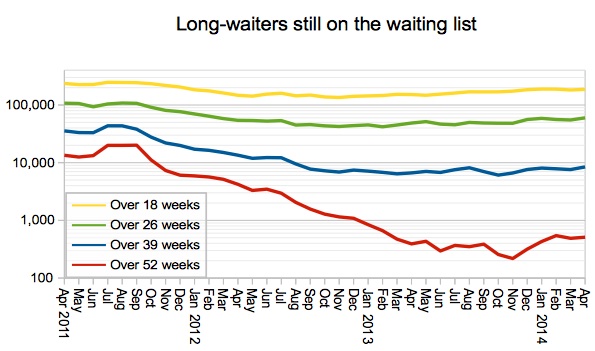
The long end of the waiting list got a little shorter in April, reversing most of the gradual decline of the last year. Without wanting to rain on the parade though, I can’t help noticing that this down-tick seems to happen every year.
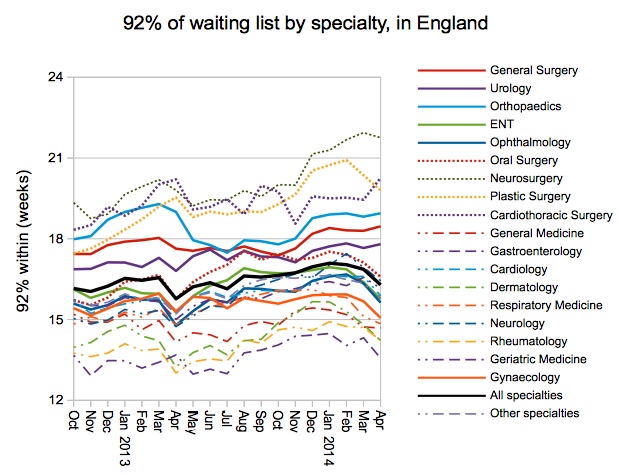
The improvement in 92nd centile waiting times was not shared by the longest-waiting specialties, which got worse, with the notable exception of Plastics which is making rapid improvements.
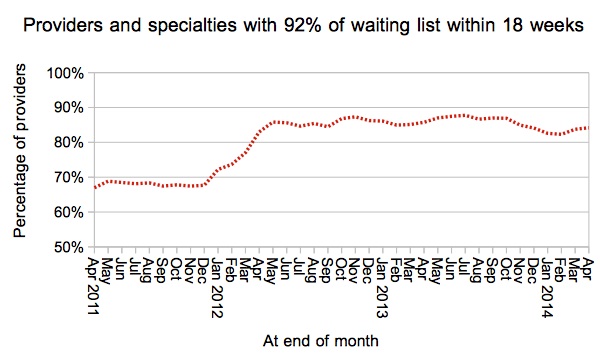
The general improvement in waiting times was shared by a rising proportion of local services keeping 92 per cent of their waiting list within 18 weeks.
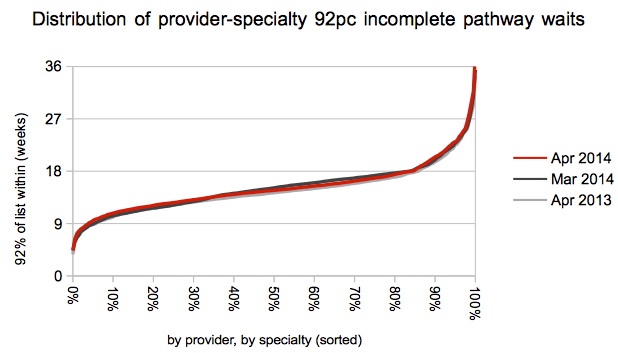
In March the improvements were mostly at the shorter-wait end of the spectrum, and in April the longer-waiters caught up a bit.
Local detail
Follow these links for interactive maps showing the all-specialties position at every Trust and CCG. For specialty-level analysis at a particular Trust, independent sector provider or CCG, visit our 18-weeks reports page.
The Nuffield in Woking have suddenly popped up at the top of the table, because the table only includes providers with at least 1,000 patients on the list and now they have 1,094. They are closely followed by Basildon who have popped right up into second place.
There is no way of knowing where the six non-reporting Trusts (many of whom have serious IT problems) would have appeared on the table; they are Barking, Havering and Redbridge University Hospitals NHS Trust, Barnet and Chase Farm Hospitals NHS Trust, Derby Hospitals NHS Foundation Trust, Tameside Hospital NHS Foundation Trust, Walsall Healthcare NHS Trust, The Whittington Hospital NHS Trust.
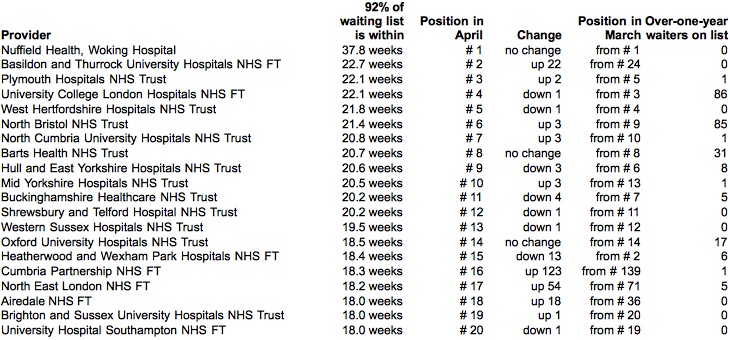
Congratulations to four providers for dropping off the table; they are Aspen – Holly House Hospital (who reduced their 92nd centile waits from 18.6 to 14.6 weeks), Lewisham Healthcare NHS Trust (18.0 to 17.2), Moorfields Eye Hospital NHS Foundation Trust (18.7 to 17.4), and Gloucestershire Hospitals NHS Foundation Trust (18.0 to 17.6 weeks).
Data for May 2014, which is the new new favourite for the English waiting list topping 3 million, is due out at 9:30am on Thursday 10 July 2014.
Return to Post Index
Leave a Reply
You must be logged in to post a comment.