Interpreting Capacity analysis: the Detail
08/04/2016by Rob Findlay
See also: the Overview | the Charts
The Detail view lays out what happened in theatre or clinic, every minute of the day, over the recent months. It looks at each day of the week separately, which suits the way that sessions are usually managed. And it allows you to drill right down into the raw data that underlies it.
The Detail view is built around a straightforward timeline of the events in that theatre or clinic. The following screenshot shows theatres (the view for clinics is similar except that there is no anaesthetic time).
This particular day was drawn from the following data. (This is the same day that was illustrated in the Overview blog post.)
The image literally describes the sequence of events during the day.
- The morning session was supposed to start at 08:30 (start of grey bar at TheatreSessionStart).
- But the first patient didn’t start being anaesthetised until 09:39 (start of pale green at TheatreAnaeStart).
- Surgery started at 10:07 (start of dark green at TheatreSurgeryStart)
- and finished at 11:10 (end of dark green at TheatreSurgeryEnd).
- The patient left the room at 11:21 (end of pale green at TheatrePatientOut).
- There was then an interval of 15 minutes before the second patient started being anaesthetised at 11:36.
- And so on.
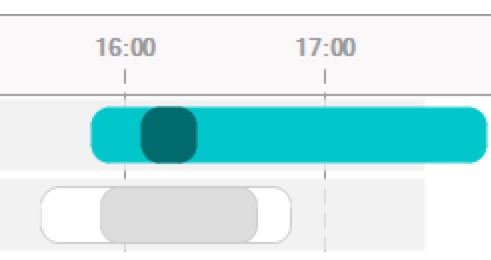
The colours are explained if you click the “Show key” button, and they vary by activity type (HeadType). In this case the daycases are in green, and the elective inpatient has been filtered-out using the display controls so it is shown in grey.
For each patient the dark section shows the surgical (operating) time, and the pale sections at each end represent the anaesthetic time before and after. I am very grateful to Professor John Yates, formerly of the University of Birmingham, for developing this very clear and intuitive style of visualisation and for kindly introducing me to it.
If you hover the mouse over any patient, the session ID and surgical procedure are shown in a tooltip, so you can see what kind of work is being done, and which patients belong to which sessions. In this case only the last patient of the day belongs to the afternoon session; the morning session overran badly.
If you click on any patient, a window will open to show the raw data for that patient, including all the timestamps. This data can also include the surgeon and anaesthetist (if you uploaded the corresponding data); however patient identifying data must not be included.
One weekday is shown at a time, because sessions are usually organised according to the day of the week, so different weekdays show different patterns of behaviour. You can select a different weekday by using the buttons below the display. If you want to see an overview of all weekdays at the same time, then the Overview is for you.
Return to Post Index

Leave a Reply
You must be logged in to post a comment.