Wait list grows for first time in seven months
The English waiting list grew in March for the first time since August 2024. This is the typical seasonal pattern when the list is neither growing nor shrinking very fast, and underscores just how slow the recent waiting list reductions have been. Credit to former Number 10 advisor Bill Morgan for predicting last month that this was going to happen.
The waiting list needs to fall by about four million patient pathways by March 2029 to restore 18 week waits, as promised by the government. That’s one million per year for the next four years. But recently the year-on-year reduction has been just 150,000. In March, it slid back further to just 118,000.
In better news, there was a reduction in the very longest waiters. Over 104 week waiters fell by 14 patient pathways to 147; over 78 week waiters fell 527 to 1,164; over 65 week waiters fell a whopping 5,842 to 7,381; and the proportion of the waiting list over 52 weeks fell by 0.2 percentage points to 2.4 per cent (the target is 1 per cent by March 2026). This is welcome. The typical waiting time experienced by non-urgent patients also fell, by 0.3 weeks to 41.9 weeks at the end of March.
In the following discussion, all figures come from NHS England. You can look up your trust and its prospects for achieving the waiting time targets here.
The numbers
The waiting list needs to be falling at about one million patient pathways per year for four years, for the 18 week waiting times standard to be restored as promised. So, over the coming financial year, the rate of reduction needs to accelerate until the line in the chart below reaches the -1,000,000 level by March 2026. But lately the trend has been going slowly in the wrong direction, and the financial environment is not getting easier.

The waiting list continues to hover at its current post-pandemic level, about four million larger than the maximum size consistent with the 18 week waiting times standard. As the chart below shows, that maximum size has a range depending on the shape of the waiting list, which we will come onto next.

Waiting times are a function of both the size and shape of the waiting list. The shape is summarised by the index below. It should improve (reduce) as the spread of waiting times across England comes down. The range in the chart above reflects the difference between the 2013-16 shape and the current shape.

The typical routine waiting time from referral to treatment (RTT) fell by 0.3 weeks to 41.9 weeks. The typical routine wait from referral to diagnosis and decision also fell slightly to 40.2 weeks, which is far too long for the estimated 27,073 patients currently on the list whose diagnosis will unexpectedly turn out to be cancer.

ENT remains the longest-waiting specialty with a typical routine waiting time of 46.3 weeks.

The waiting list grows when patients are added to the list faster than they come off it. Unfortunately, around 10-15 per cent of additions are usually removed without registering as a clock stop, so the clock start (demand) and clock stop (activity) figures do not reconcile with changes in the waiting list size. The anomalies are much larger and more variable at local level, reflecting poor data quality.
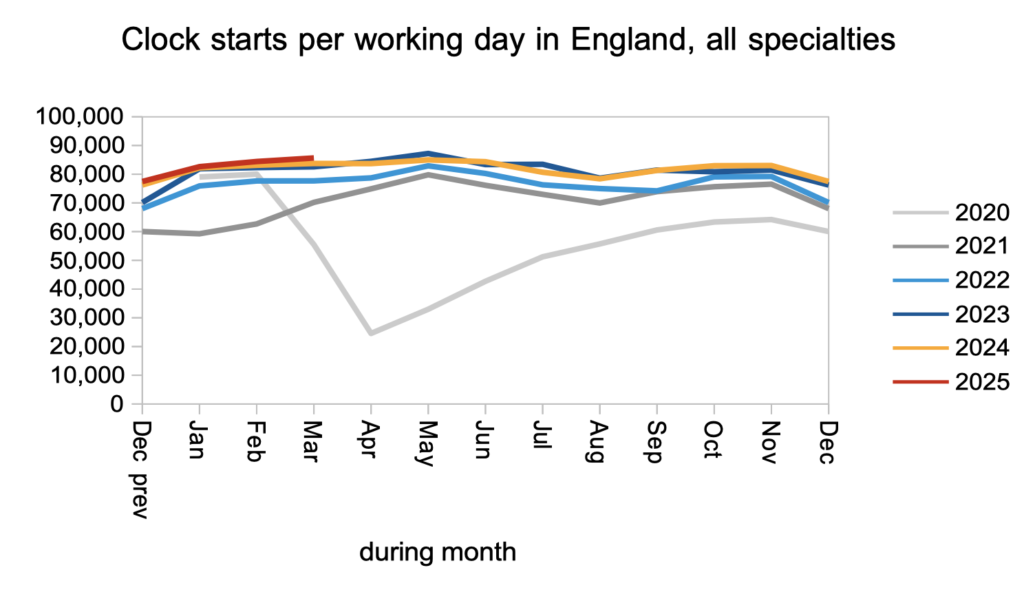
Having said that, it is meaningful to look at how things have changed over time. Clock starts remain broadly steady post-pandemic. The expected surge of pent-up demand from the pandemic shutdowns never materialised – it would be interesting to know what happened to the millions of patients who would normally have been referred over that time.

The rate at which patients ended their RTT pathways for reasons other than admission – i.e. at the outpatient and diagnostic stages of the pathway – was close to last year’s rate.

Patients were also admitted for inpatient and daycase treatment at close to last March’s rate, ending a good run of significant year-on-year increase. This is the expensive, capacity-hungry stage of the RTT pathway, and where financial constraints can be expected to bite hardest.

Referral-to-treatment data up to the end of April is due out at 9:30am on Thursday 12th June, and will start to show the impact of the tighter financial environment in 2025-26.
