Wait list falls for sixth consecutive month, but too slowly

NHS England are understandably keen to tell the world that “the overall waiting list fell for the sixth month in a row in February“. Indeed it did. But slowly, which is important for two reasons.
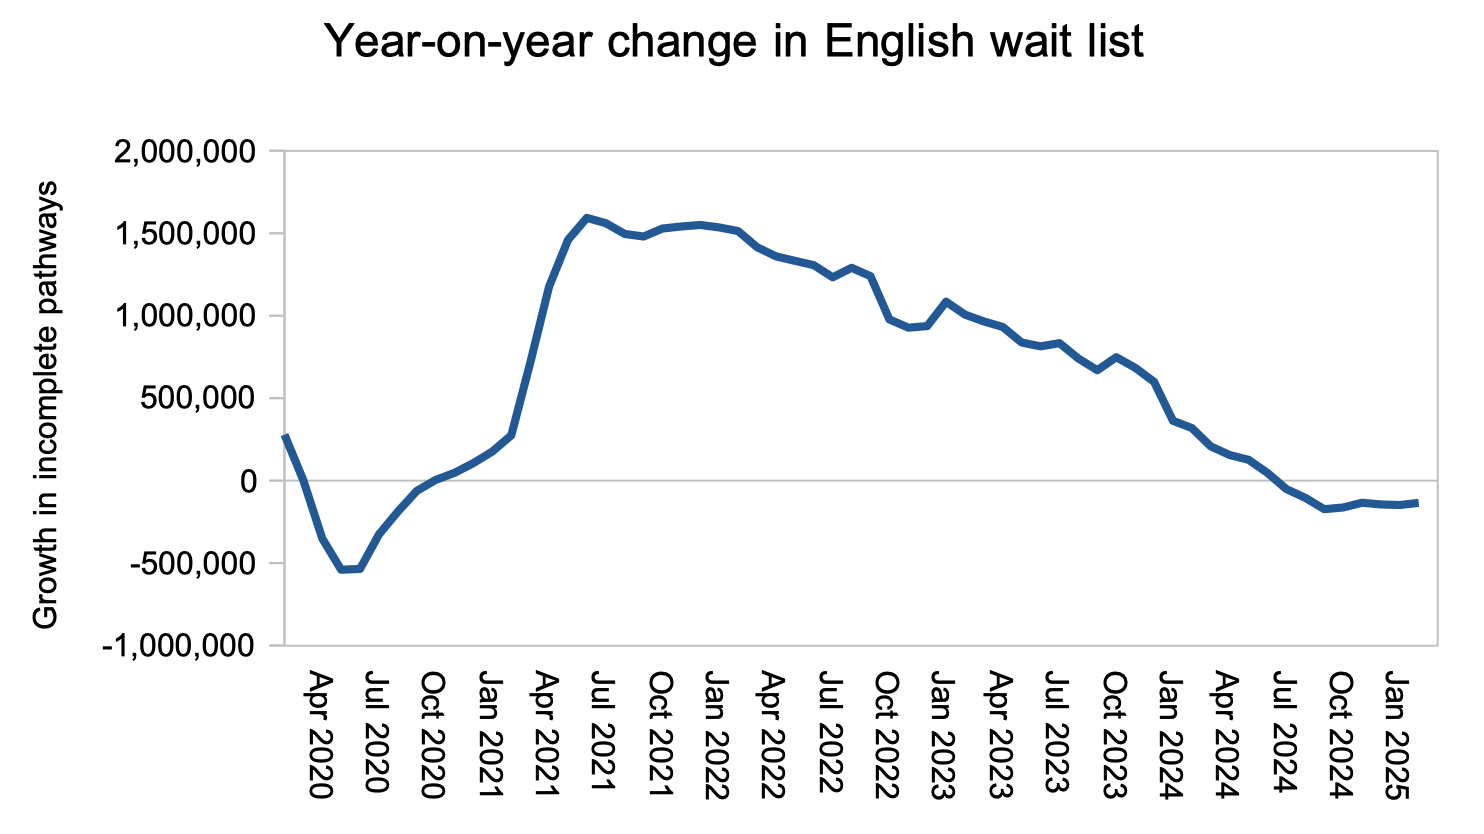
First, the waiting list needs to fall at a rate of one million per year for the next four years to restore 18 week waits by March 2029. But the year-on-year reduction was only 135,000 in February, and it has hovered at around that level since September.
Second, this cause for celebration is probably coming to an end. As Bill Morgan (a Number 10 advisor under the previous government) noted on X, the trend of falling waiting lists is likely to be overwhelmed by the normal seasonal waiting list pressure that tends to arrive with spring.
In the following discussion, all figures come from NHS England. You can look up your trust and its prospects for achieving the waiting time targets here.
The numbers
A growing waiting list means that problems are mounting up, and a falling waiting list means they are going away. So a falling waiting list is a good thing, even if it is happening too slowly.
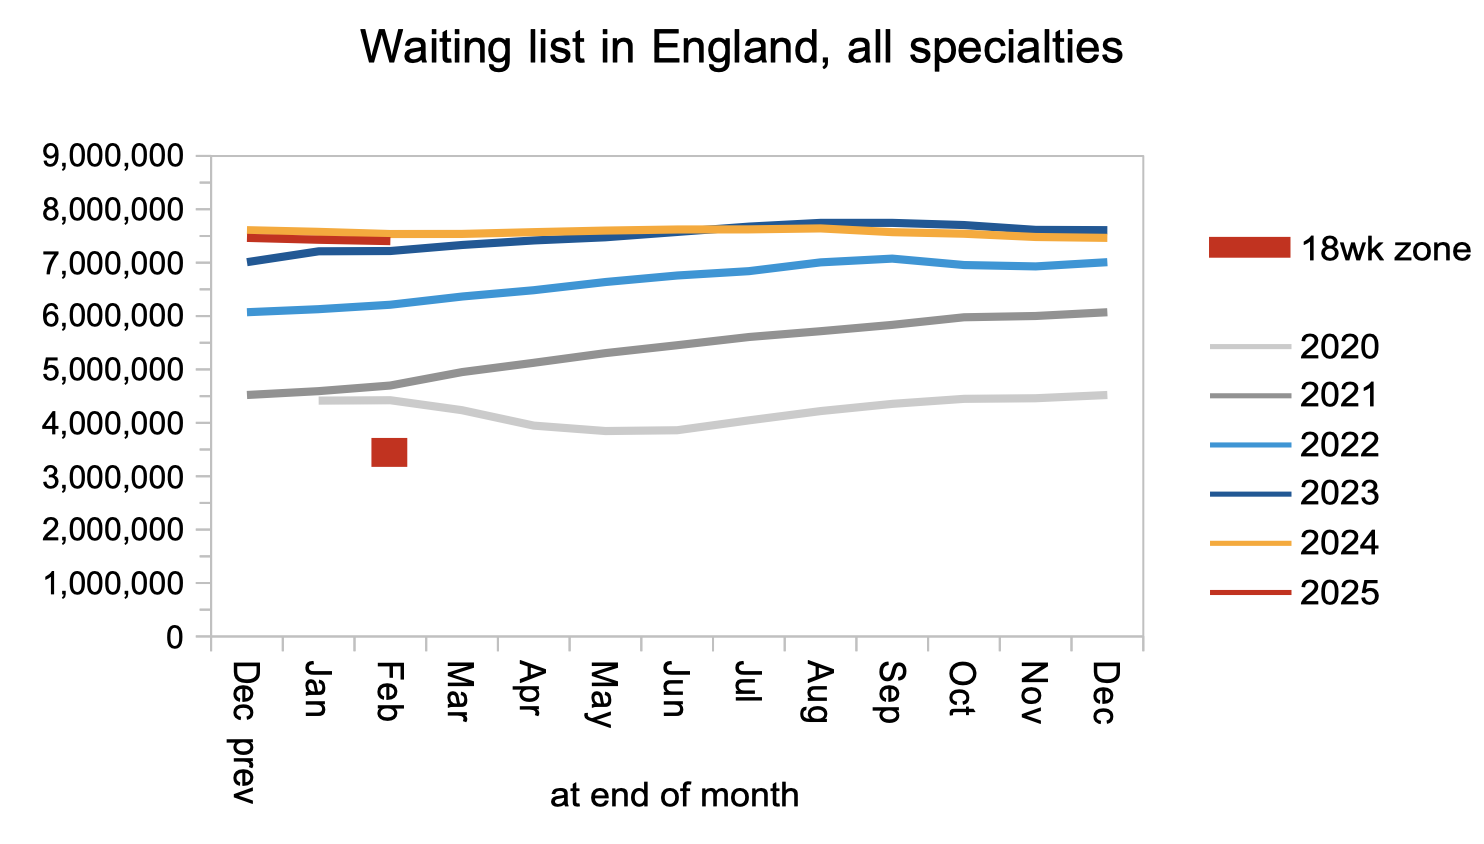
The size of the waiting list needs to fall to the red zone in the chart below: the top of the zone will suffice if the waiting list shape gets back to 2013-16 levels, and the bottom of the zone is required if the waiting list shape does not improve. The reduction needed is about four million patient pathways, and there are four years to do it in, hence one million per year.
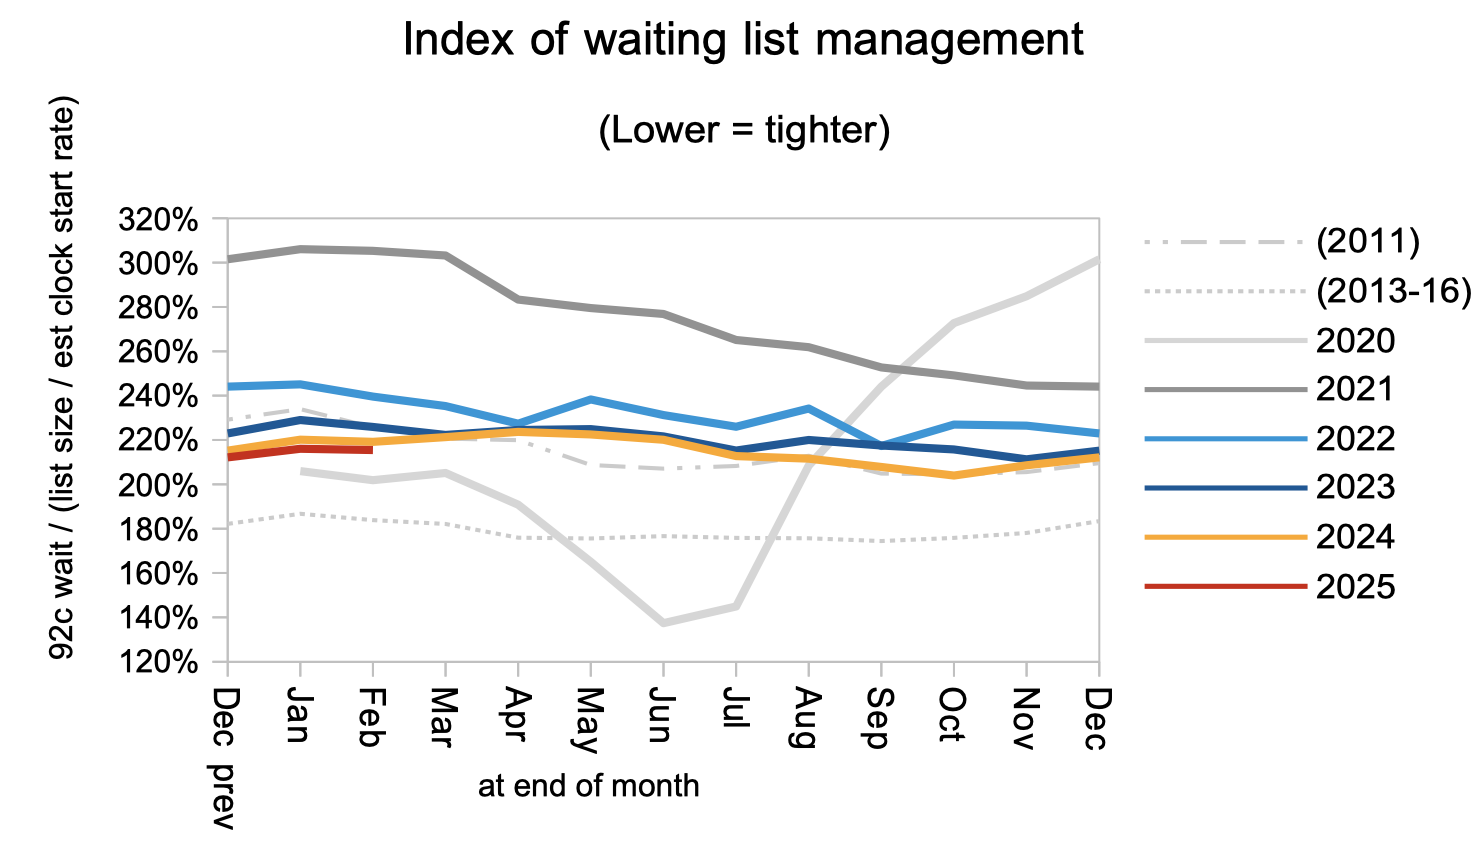
The recent history of the waiting list shape is shown by the index in the chart below.
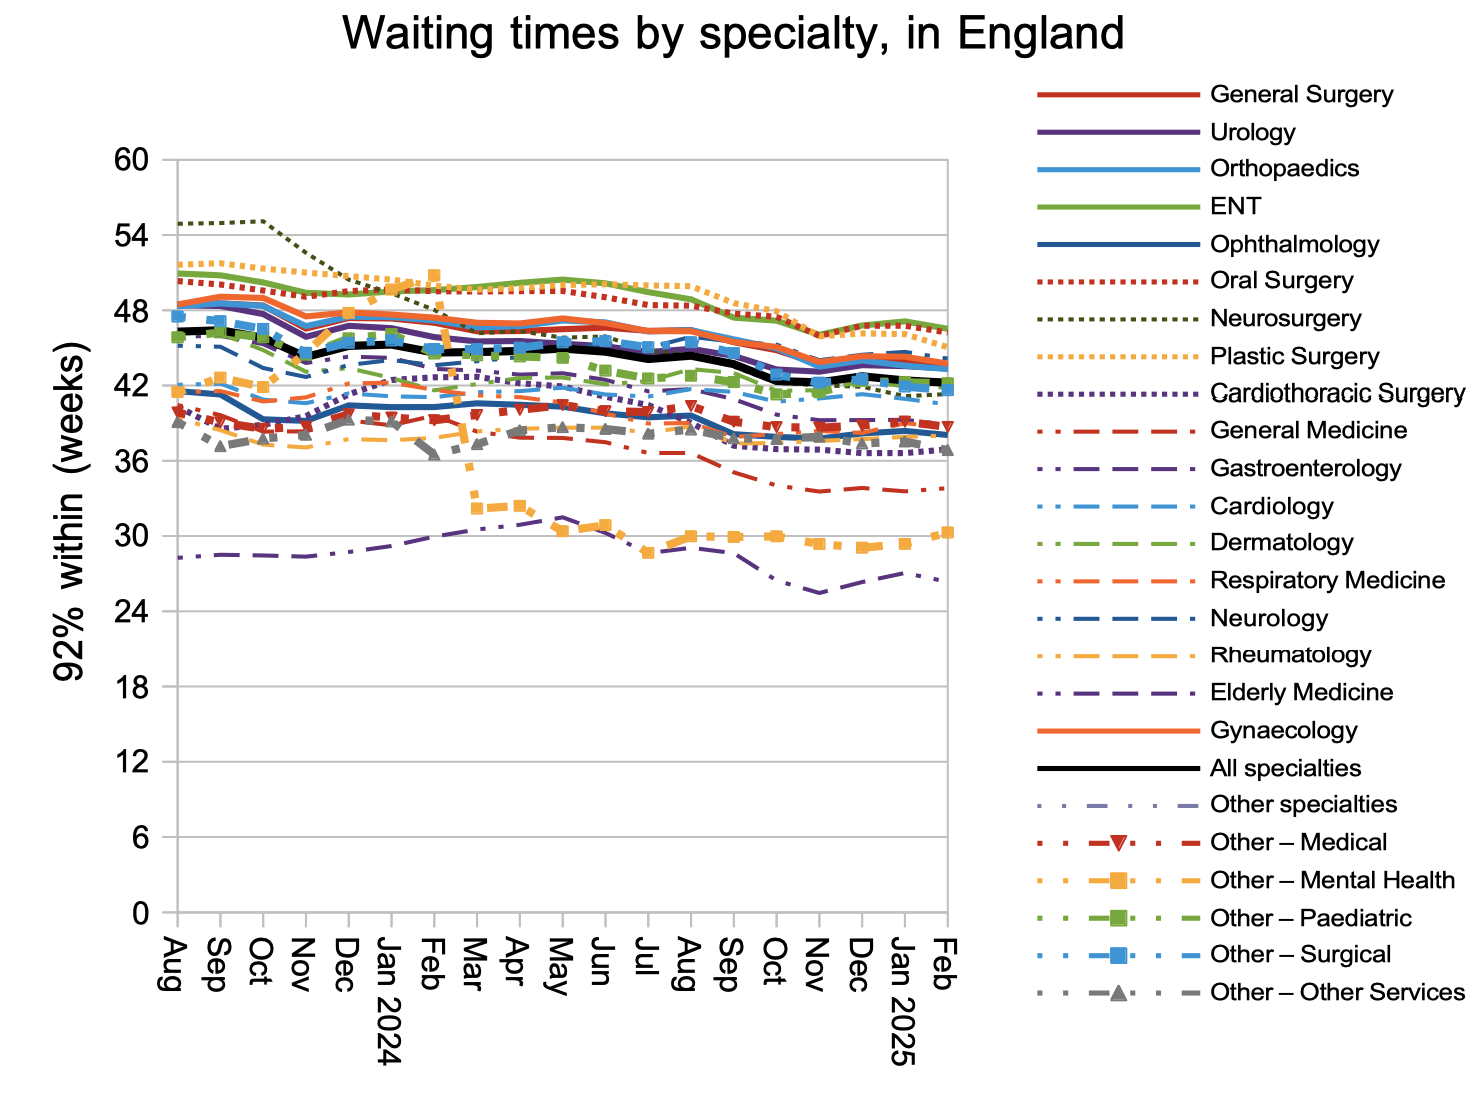
As the waiting list falls (but slowly), waiting times will also tend to fall (but slowly). And waiting times are what matter to patients. Not the size of the waiting list, not the percentage within 18 weeks, but the waiting times they are likely to experience. The routine waiting time from referral to diagnosis and decision (the thinner dark line below) was 40.6 weeks at the end of February, which is too long for the estimated 26,952 patients whose eventual diagnosis will unexpectedly be cancer.
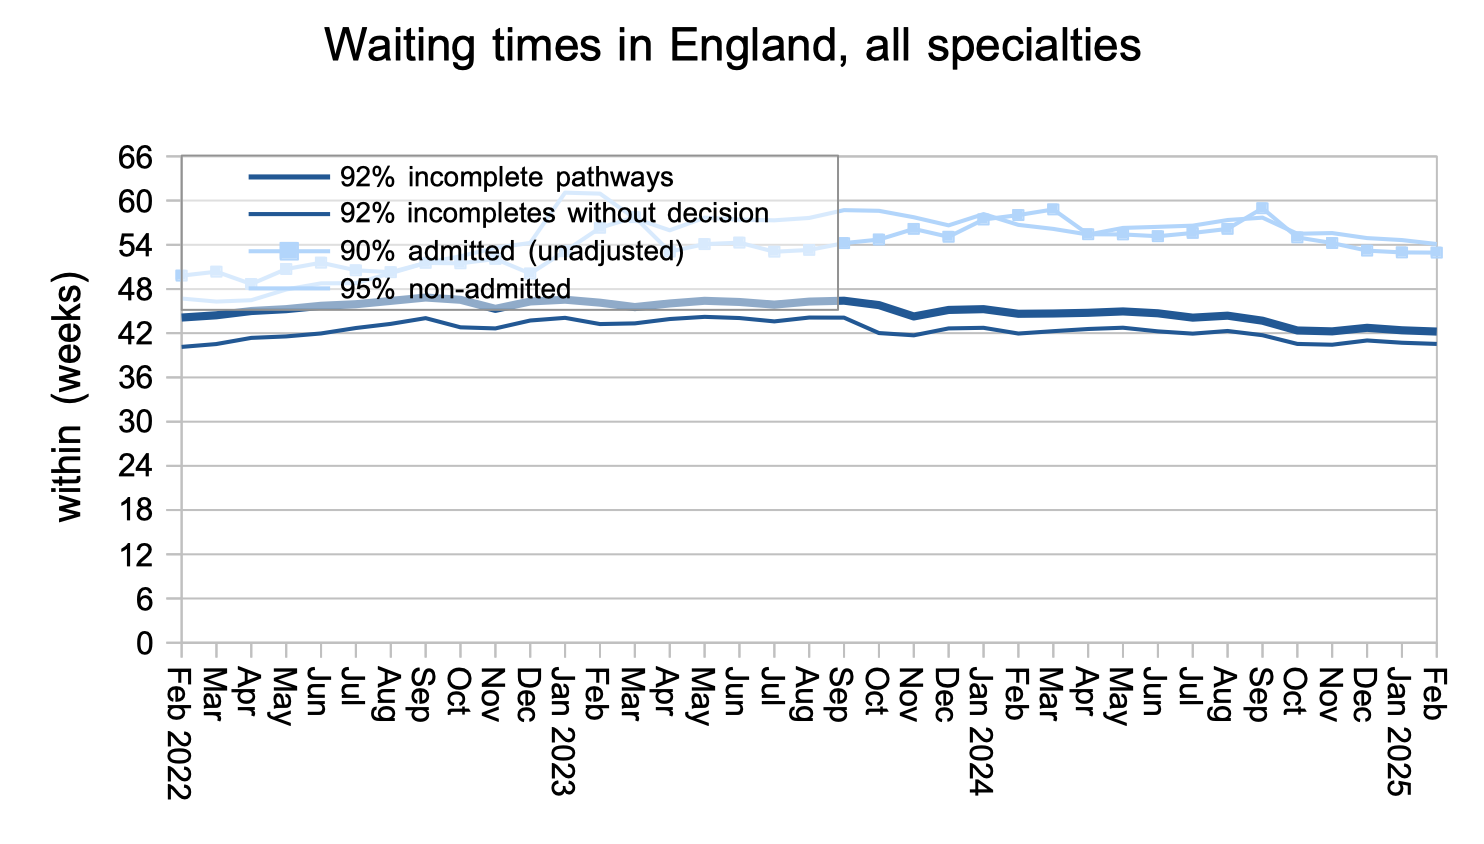
ENT was the longest-waiting specialty with a typical routine waiting time of 46.5 weeks nationally from referral to treatment.
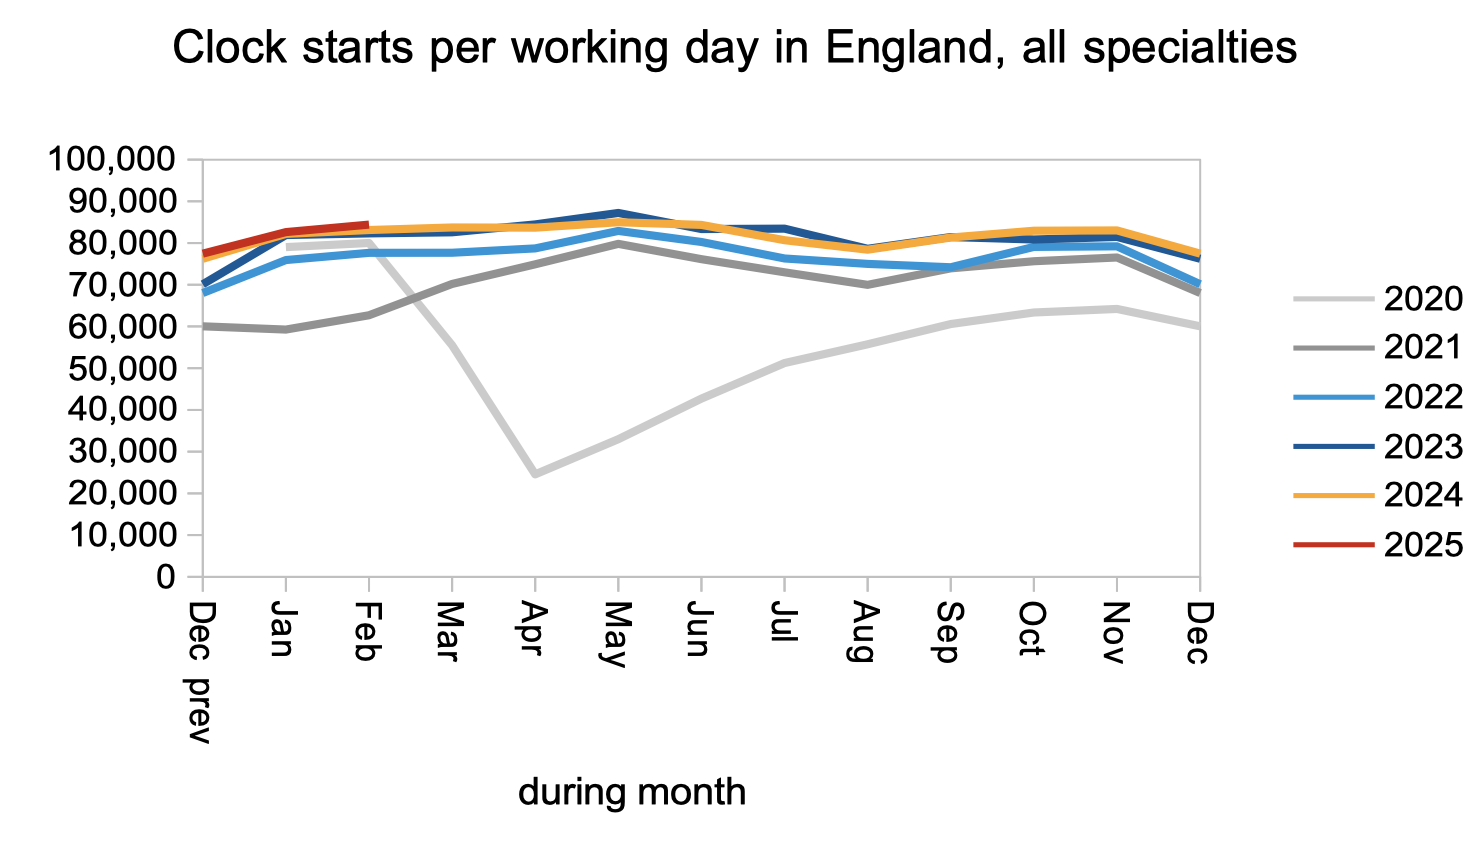
Waiting lists accumulate when patients join the waiting list faster than they leave it. The chart below shows that patients joined the waiting list at a similar rate to the last two years.
Most patients leave the waiting list because they have been treated or discharged, and we have data about them. But some are removed administratively because they were wrongly listed as waiting, or because they did not attend their first outpatient appointment; unfortunately data is not published about them, but we can tell by balancing the other data that 10-15 per cent of patients are removed that way.
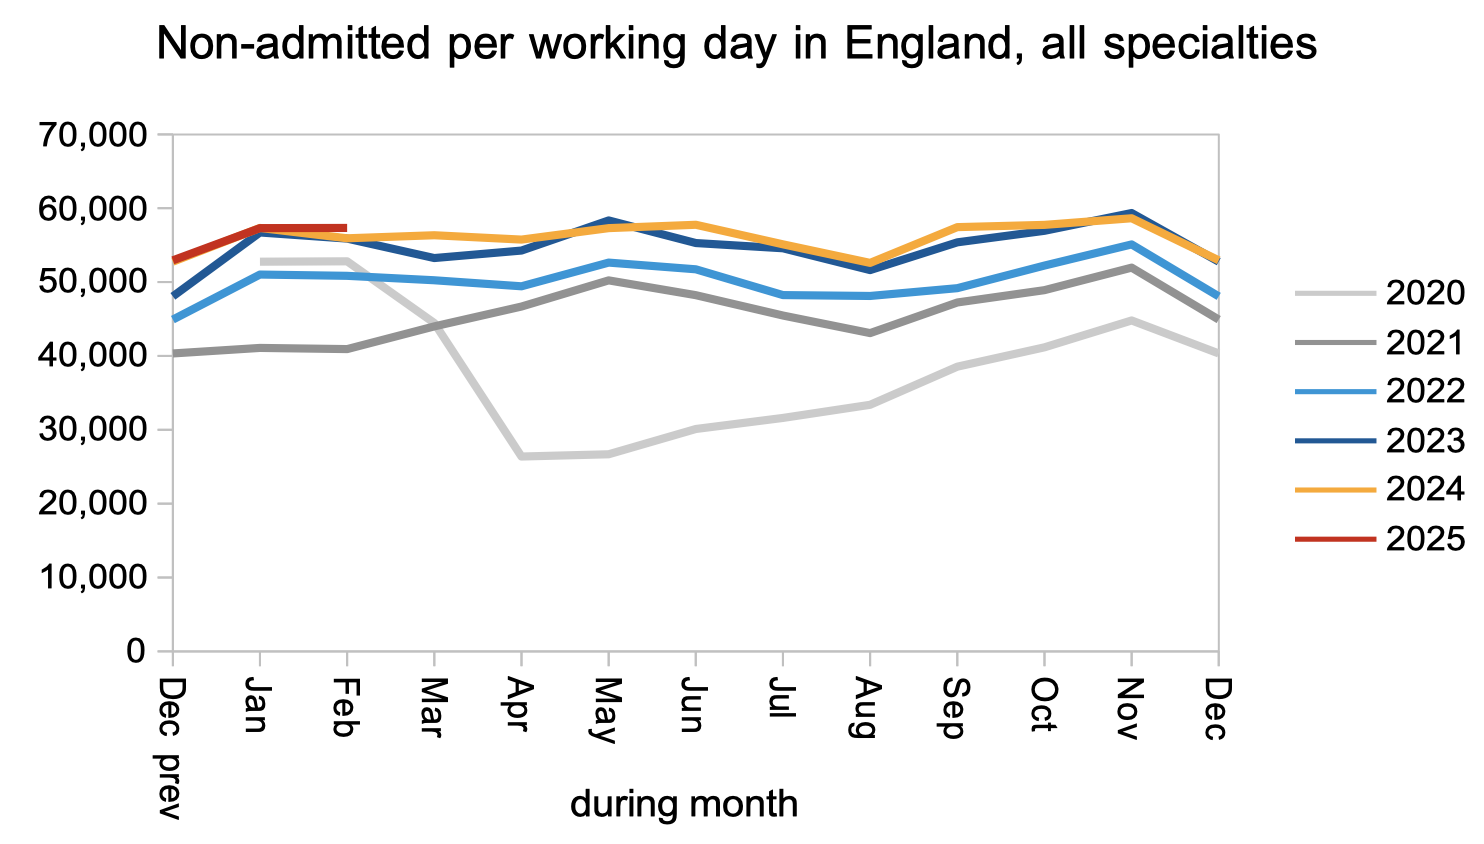
The next chart shows how many left the waiting list because they were treated or discharged from clinic, and again the rate is similar to the last two years. This activity is low cost per case and high impact, and the NHS would be advised to focus efforts on increasing it.
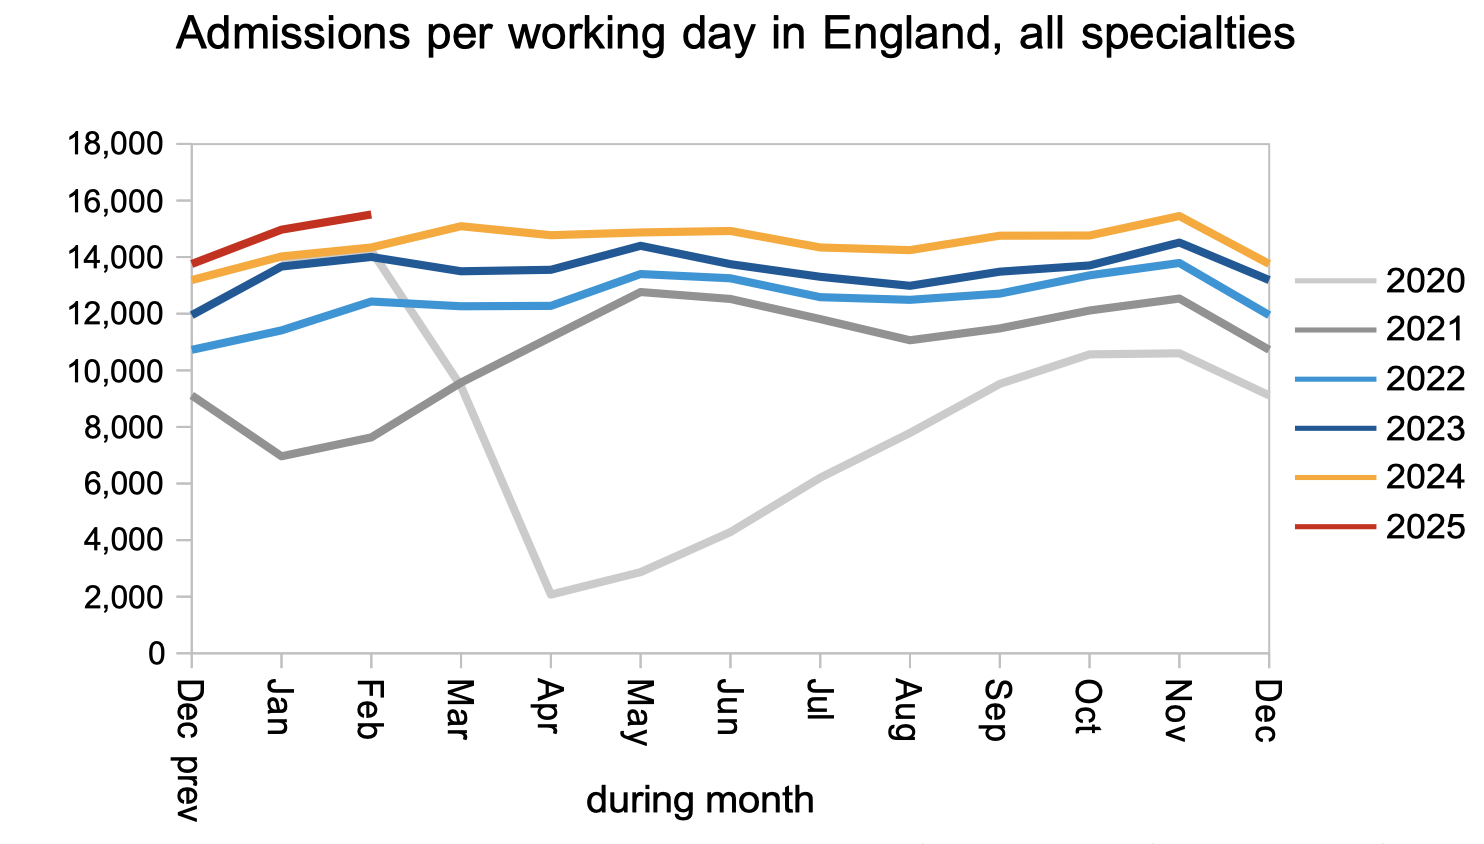
A minority of patients go on to need admission for inpatient or daycase treatment. The numbers are up in spite of well-publicised winter pressures, in response to targets to reduce the number of ultra long waiters.
Referral-to-treatment data up to the end of March 2025 is due out at 9:30am on Thursday 15th May.