The waiting list grows, but 18 week waits improve
22/07/2013by Rob Findlay
The English NHS delivered a record-best performance on 18-week waits in May, in response to new incentives that tackle long-wait backlogs directly. However the total number of patients on the waiting list continued to grow, well above the trend of recent years, and this is a sign of waiting times pressures to come. One-year-waits deteriorated slightly, which is disappointing after the spectacular improvements of recent months.
It is normal for the waiting list to grow at this time of year, but it has been growing so fast in recent months that we are now in uncharted territory for sustaining the 18 week target. That is not to say that 18 weeks is doomed; now that the penalty regime focuses on preventing long-wait backlogs from building up in the first place (and downgrades the penalties handed out to hospitals that dare to treat their long-waiting patients), it is possible that the NHS is improving its patient scheduling and resource allocation enough to overcome the bigger waiting list.
But if the waiting list continues to grow, then at some point a limit will be reached and we will see widespread breaches of the 18 week target. Between now and winter, commissioners and providers alike would be wise to pay particular attention to the size of their waiting lists, and how they and waiting times are expected to vary over the summer holidays and winter.
Commissioners and Monitor should also look favourably upon requests for a penalty waiver on the 90% admitted patients target; it serves nobody to punish hospitals for doing the right thing by treating their longest-waiting patients first.
All figures come from NHS England, who have taken over responsibility for this data series. If you have a national statistic that you’d like to check up on, you can download our NHS waiting times fact checker
England-wide picture
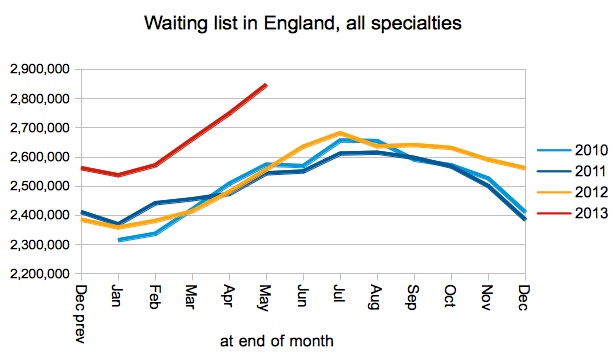
The reported number of patients on the waiting list is the largest since May 2008, i.e. before 18-weeks was first achieved, and more than a year before it was achieved ‘properly’. On recent trends, we can expect the waiting list to peak somewhere shy of 3 million.
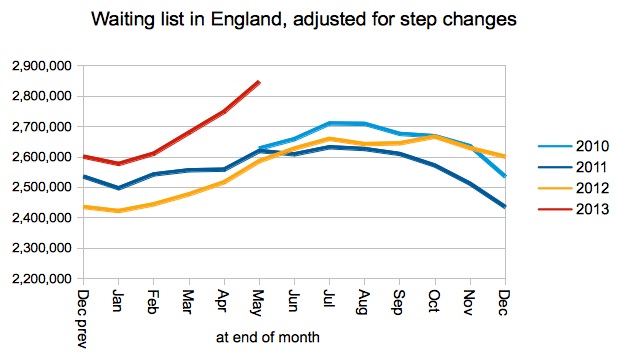
Even if we adjust for improvements in data quality, the waiting list is much larger than in recent years (and the increase looks even sharper).
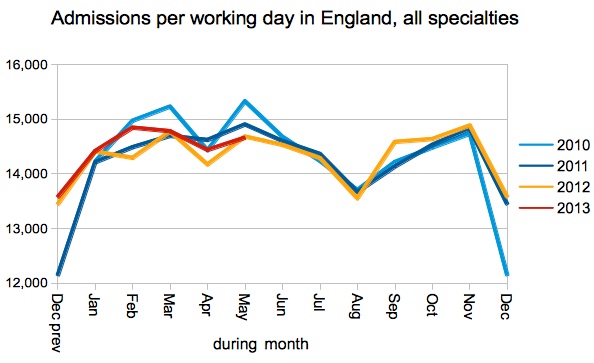
Is the rising waiting list caused by winter cancellations? Apparently not. Admissions have held up nicely over the winter, and continue to follow the level of recent years. Referrals on the other hand have been rising, and they are the more likely explanation.
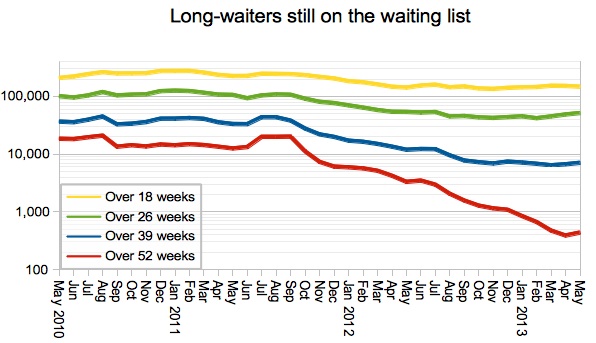
After the dramatic improvements since autumn 2011, it is disappointing that one-year-waits ticked up in May. Given the toughness of the ‘zero tolerance’ penalties for having one-year-waiters (£5,000 per patient, every month), these remaining ultra-long-waiters must be in subspecialties with particular difficulty in balancing capacity and demand. Nearly half are in Orthopaedics, and my guess is that many of those will be waiting for spinal surgery.
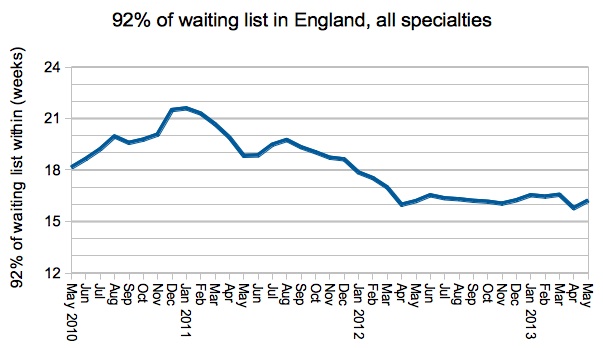
My favourite measure of long-wait performance slipped slightly in May, from its record-best in April. Small variations aside, this indicator has been essentially flat for the last year.
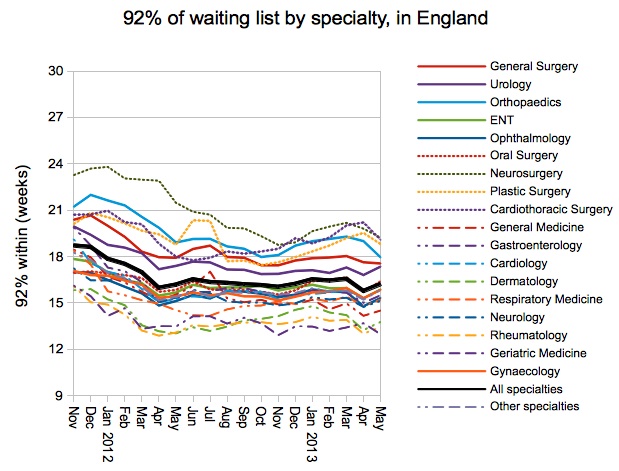
At specialty level there is convergence on the 18-week target, with long-wait specialties improving and short-wait specialties deteriorating. On the one hand, you could say the NHS is allocating its resources where they are most needed. On the other hand, it is always a shame to see any areas where ground is being lost. Orthopaedics achieved the 92 per cent target for the second time ever, having previously dipped into success territory for just one month back in October 2012.
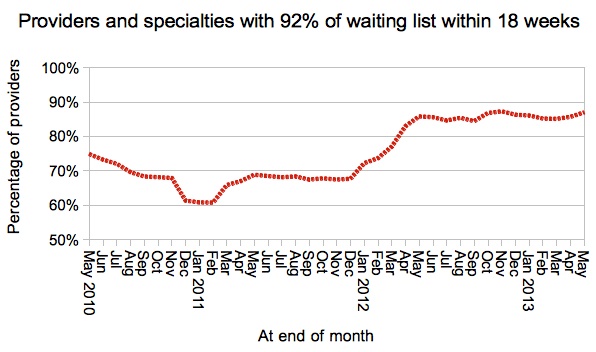
The proportion of services achieving the main target (that 92 per cent of the waiting list – incomplete pathways – should be within 18 weeks) remains steady.
Provider top ten
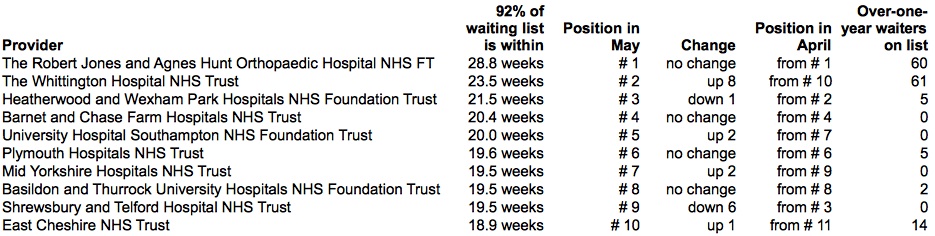
The Trusts with most one-year waits were: Whittington 61, RJAH 60, Barts 48, King’s 44, and East Kent 30.
In terms of performance against the main ’92 per cent’ target, the top ten this month is:
The June 2013 data is due out at 9:30am on Thursday 15 August 2013. Happy holidays!
Return to Post Index