Your 18 week waits: May 2013 data
22/07/2013by Rob Findlay
Here is the local picture on 18 week waits, fully updated with the latest RTT waiting times data just released by NHS England.
If you want to pick an NHS Trust or independent sector provider, or an NHS Commissioner, you can get a full analysis of the pressures in any specialty here.
Where are the very-long waiters?
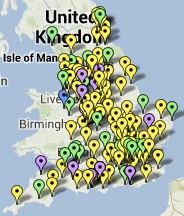
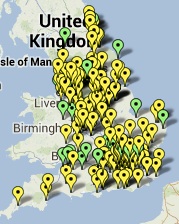
The following maps compare one-year waits, 18-week waits, and total waits, with the values a year before. The first map shows providers, and the second shows commissioners and is therefore on a population basis.
The provider map shows NHS Trusts only to avoid map clashes with independent sector providers on the same site, but you can download the full data for all providers and specialties at the end of this post. In the map, click a pin to see the detail, then click the organisation name to get a full analysis.
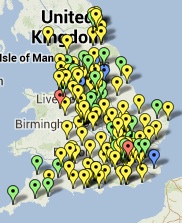
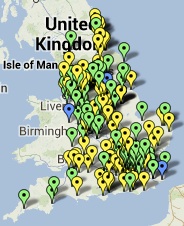
92 per cent of the waiting list within 18 weeks
The most meaningful of the official waiting time measures is that 92 per cent of the waiting list (‘incomplete pathways’) must be within 18 weeks. So these maps shows how long 92 per cent of the waiting list has actually waited.
You can download a table of all the specialty-level detail here: Map data.xls.zip
Return to Post Index