Awash with waiting times measures
19/08/2013by Rob Findlay
Here’s a question for you. One that is asked in every Trust, about every service, every month. The question is: “Do we have a problem with 18 week waits?”. And the honest answer, using the metrics that many Trusts present, is “We can’t tell.”
Why? Even if you get quite a lot of detail in your performance report, you’ll probably have to rely on a time series chart like this (which was created using real data from an English NHS Foundation Trust):
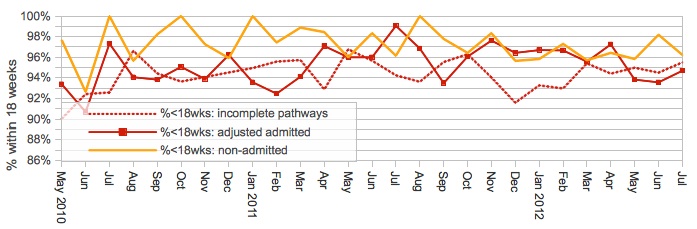
Is this a helpful chart? At a very simple level it’s a little confusing because the standard is different for each line: 92% for the incompletes, 90% for the adjusted admitted, and 95% for the non-admitted lines. So you may find that this data is split into three separate charts, with their own ‘target lines’ drawn in, as if these three measures were unrelated to each other.
It would be somewhat better to compare all three performance measures directly against 18 weeks by presenting the chart like this. The chart below shows how long 92% of incomplete pathways (i.e. patients on the waiting list) have waited, and similarly for 90% of patients admitted each month, and 95% of non-admitted clock stops each month. Each line can be compared against the same target: the 18 weeks standard in the NHS Constitution.
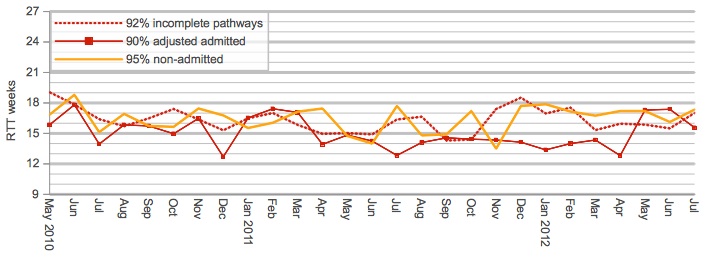
As well as getting everything onto a single chart, there is another reason why this presentation is better. If your waiting list is well managed, and routine patients are treated broadly in turn, then this chart will show exactly how your routine waiting time gradually rises and falls from month to month. But if you use the percentage-style chart we first looked at, it will just flip suddenly from very high performance (when routine waits are nicely below 18 weeks) to very low performance (when they breach) without any advance warning that waits have been creeping up.
So, back to our original question: “Do we have a problem with 18 week waits?” Our thought processes might go something like this…
Hmm. May as well start with the easy one: the non-admitteds. That’s the outpatients. They’ve been fine since a minor breach two years ago, bumping along below the 18 week line. Actually non-admitted is usually fine. Nothing to worry about. So on to the next one…
Incomplete pathways: This is the new target (must remember to pay attention to it). It’s below 18 weeks too, except for a little episode last Christmas when it popped over briefly. It rose a little last month but is well within the normal range. So probably no problems there. Next…
Admitted patients: That means inpatients and daycases, and that’s the one we usually have trouble with. It’s jumped up a bit, which is potentially worrying. But it seems to be back under control now. So that looks fine as well.
All in all, a clean bill of health, then. Yes?
Well actually, no. Although those charts tell us how we’re doing relative to the centrally-prescribed standards, they aren’t clear about whether we have a problem or not.
The admitted and non-admitted lines are particularly misleading. Ask yourself this: if more long-waiters are admitted, is that a good thing or a bad thing? Well, if we have long-waiters on the list then we should treat them, in which case treating lots of long waiters would be a good thing even if it caused us to fail against the (perverse) target. The alternative is to artificially restrict the number of long-waiters we treat, which is easy to do, but is unfair to the long-waiting patients who we refuse to treat and makes our backlog worse. Of course ideally we would not have long-waiters on the list in the first place (which was the original intention of these targets), in which case performance would naturally be excellent, but we can’t tell whether that’s the case from these lines alone.
The point is that “good” performance on the admitted and non-admitted measures does not tell us whether we have a problem or not; for that, we have to look at the waiting list.
The incomplete pathways line is based on the waiting list, so it is more helpful. It comes closer to showing the waiting times pressure, but even then it isn’t clear-cut. Waiting times are a function of two things: the size of waiting list and the order in which patients are scheduled; so it is quite possible for changes in scheduling to mask any underlying pressures. In the chart above you can see from the admitted line that more long-waiting patients were treated in May and June; this stopped long-waiters from building up on the waiting list (and therefore stopped the incompletes line from rising) but it also means that the incompletes line doesn’t show the underlying pressure clearly.
According to this Foundation Trust’s published papers, in real life the Governors were given only the RTT measures presented above, and simply told that all the targets were achieved. But in reality this service was in deep trouble and our target-based charts haven’t revealed this at all.
Let’s add one more line to see why. It’s the grey one: the size of the waiting list.

In April, the size of the waiting list rose sharply. That put extra pressure on waiting times, which hasn’t shown up in the other metrics (yet). By concentrating only on the targets, we have missed the most important part of the story. What happened next?
The sharp-eyed among you will have spotted that the above charts only go up to last summer, and you are probably wondering how things turned out since then. In real life, performance got worse fast. Here is the most recent data, taken from our regular 18-weeks reports:
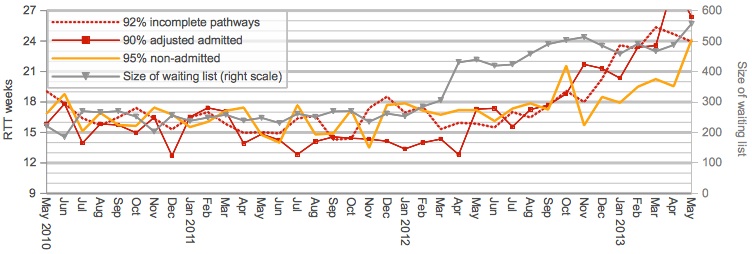
The waiting list carried on growing. Commendably, the Trust tried to deal with the backlog by increasing activity, and treating the longest-waiting patients even though this caused a breach of the admitted patients target. But it wasn’t enough, and soon all the RTT metrics went pear-shaped as the pressures fed through.
All in all, it was a bit of a disaster, and it would have been good to have had the earliest possible warning of trouble ahead so that proportionate action could have been taken earlier at minimum cost.
So what can you do to avoid this kind of problem?
Firstly, and most simply, monitor the size of the waiting list. Include all patients, booked and unbooked, and ideally monitor the list size for each stage of treatment and at subspecialty level.
Secondly, know your limits: how big a waiting list is too big? This is a trickier calculation because waiting times depend on clinical priorities and removal rates, as well as list size and demand. We have researched this thoroughly, and provide free tools for working it out (after signing in on the Gooroo website; registration is free).
Thirdly, have a plan that sets out the expected week-by-week variations in demand, capacity, activity and waiting times throughout the year (this is what our Gooroo Planner software does). Variations often repeat themselves, because they are largely driven by the school holidays and the changing seasons, so many fluctuations are predictable well in advance. Then you can monitor your list size against the expected profile, and know whether it’s out of line for the time of year and not just against the target.
The quickest way to get started is to ask for a free on-site demo of Gooroo. Just click this link to send us an email and we’ll be delighted to set up a meeting:
Return to Post Index