Waiting list grows more slowly as NHS catches up
19/08/2013by Rob Findlay
The English waiting list grew again in June, to the largest size reported since April 2008. But the rate of growth has slowed, helped along by a slightly higher rate of admissions than in recent years. The slowdown was expected; usually the waiting list peaks in July/August and then shrinks again towards winter.
At the longer-waiting end of the list, the position on 18-week waits remains good and stable, and one-year-waits reached a new record-best.
So why isn’t the bigger waiting list pushing up waiting times?
Waiting times are a function of two things: the number of patients on the waiting list, and the order in which those patients are scheduled. Since April, the new waiting-list-based targets have encouraged better patient scheduling (in contrast to the older admission-based targets which encouraged bad scheduling), and I suspect this is the most important factor that is holding down waiting times now.
In the following analysis, all figures come from NHS England. If you have a national statistic that you’d like to check up on, you can download our Gooroo NHS waiting times fact checker. This has now been updated for the latest revisions from October 2012 onwards.
England-wide picture
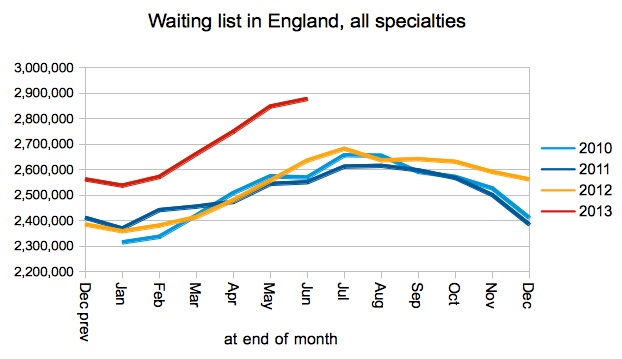
The as-reported waiting list is heading for the seasonal peak, and the increase was less than in recent months. The reported waiting list is now the biggest since April 2008.
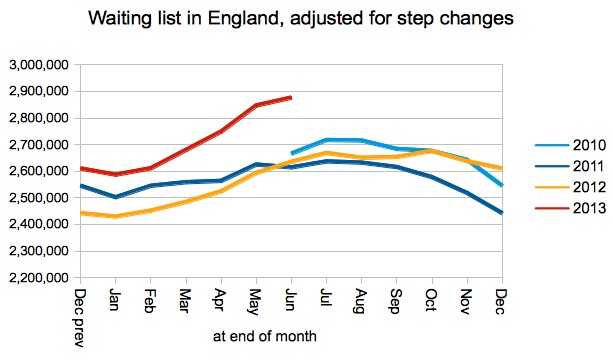
The English NHS is improving its ability to count all patients who are waiting for treatment, across a multitude of hospital outpatient, diagnostic and inpatient administration systems. If the national waiting list is adjusted for step-changes in local list sizes, in an attempt to correct for these welcome improvements, the waiting list still looks very large but the growth is a bit less dramatic.
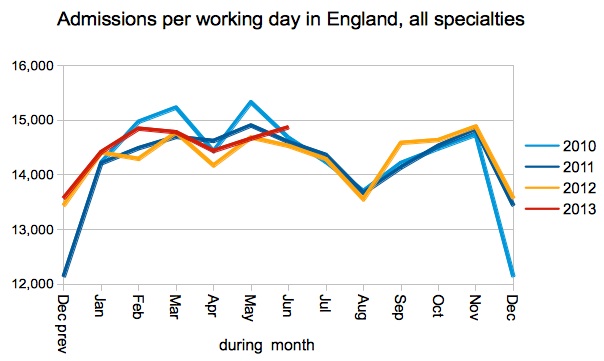
Admissions per working day were a little higher in June than in recent years. This has helped the NHS catch up with the growth in referrals, and held back the growth in the waiting list.
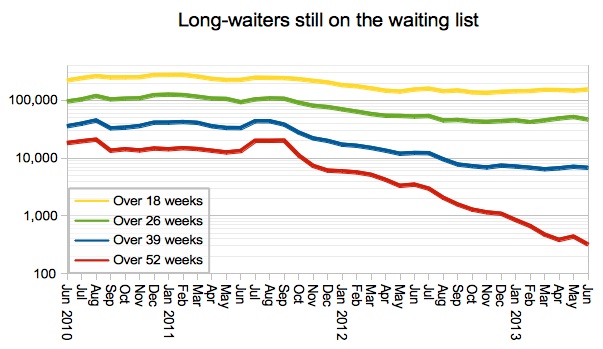
One-year-waits resumed their downward trend, to a new record best of 318 England-wide. Only 40 (out of 203) NHS Trusts have any one-year-waiters at all.
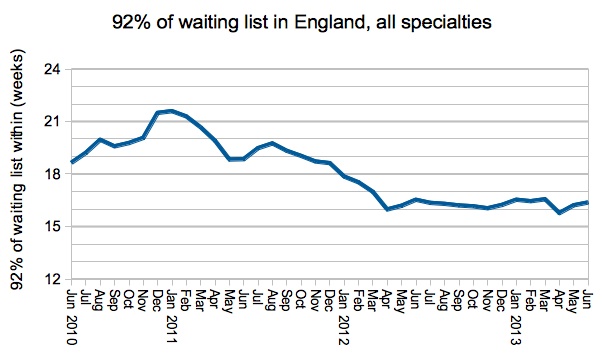
Even though the waiting list has been much larger than usual for a few months now, the waiting time of 92 per cent of the waiting list remains stable. It probably isn’t sensible to attribute this success to any single cause, but I expect that the new waiting-list-based targets are probably the biggest factor keeping them low.
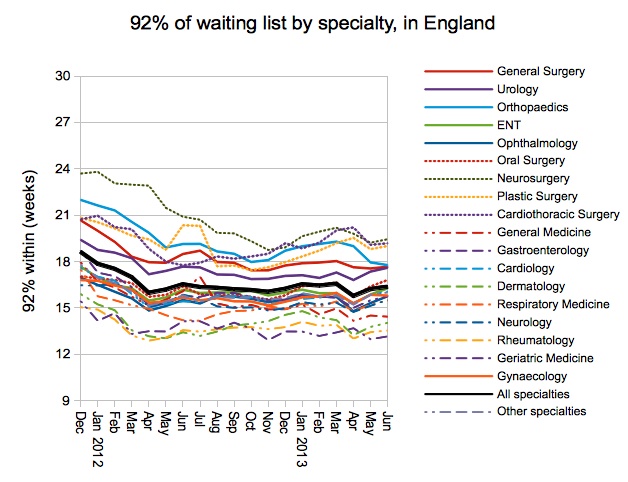
At specialty level, the big news is that Orthopaedics met the target with its best-ever performance.
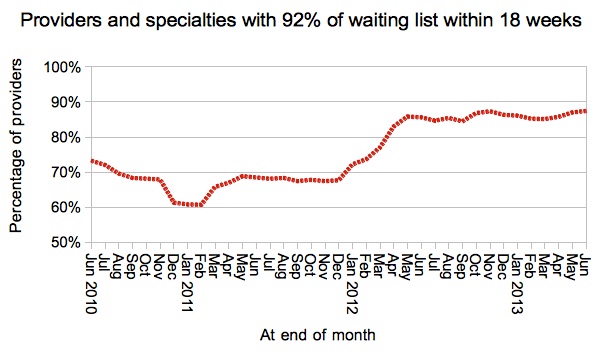
The proportion of local services achieving the incomplete pathways (waiting list) target remains steady.
Provider top ten
The Trusts with the largest number of one-year-waiters were: Barts (51), RJAH (40), Kings (31), Kingston (24), Whittington (23), and East Kent (21). Only 40 NHS Trusts now have any patients waiting over a year.
Against the ’92 per cent of incomplete pathways within 18 weeks’ standard, the provider top ten for June is:
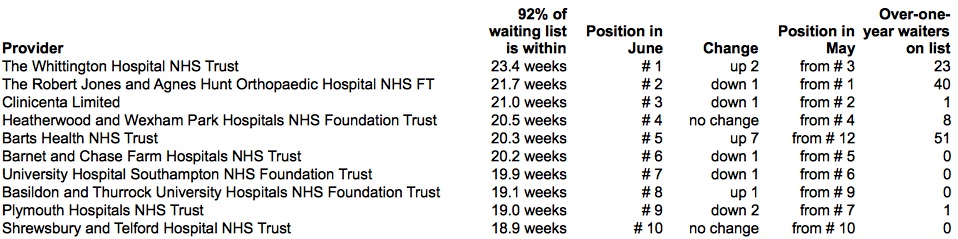
Only one Trust dropped out of the table in style, so congratulations to Mid Yorkshire Hospitals NHS Trust, who fell from 8th place to 18th with a reduction in 92nd centile waits from 19.5 to 18.0 weeks.
The July 2013 data is due out at 9:30am on Thursday 19 September 2013.
Return to Post Index