And so it begins: the decline of 18 week waits
17/02/2014by Rob Findlay
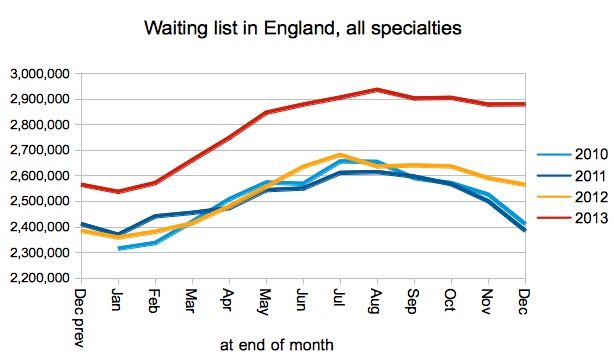
Ever since “18-weeks” was first achieved in summer 2008, the waiting list has shrunk in the autumn and grown back again in the spring. Not any more. In 2012 it did shrink in the autumn, but not much, and the waiting list has been bigger ever since. In 2013 things were even worse: it may not have shrunk at all.
So, headline writers: mark your calendars for the 22nd May and 19th June. Those are the dates when the published waiting list statistics are likely to show the English waiting list passing 3 million, for the first time since March 2008 (or, if you prefer, “since the last Labour government”).
What about 18 week waits? The targets are still being met at national level despite the long waiting list, and will probably still be met for several months to come. However there are now distinct signs of modest but continuing slippage across the main indicators. Unless something can be done to hold down the number of patients on the waiting list (and there is no sign of this happening), there is now a significant risk that 18 weeks will be breached at national level during 2014.
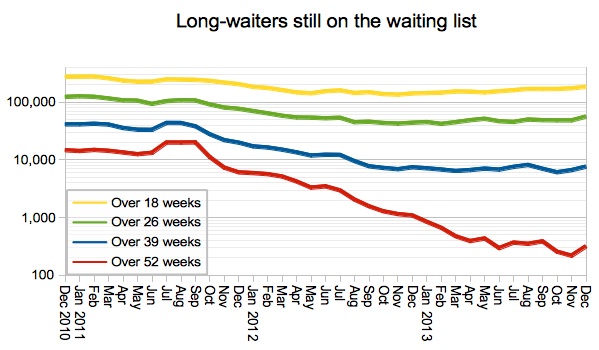
One-year waits have slipped a bit too, but remain historically very low with just a few hundred patients waiting that long (compared with many thousands as recently as 2012). Nearly all Trusts have now cleared their one-year backlogs, and most one-year-waiters are concentrated in just a few hospitals.
In the following analysis, all figures come from NHS England. If you have a national statistic that you’d like to check up on, you can download our Gooroo NHS waiting times fact checker
England-wide picture
The waiting list grew in December, which is the first December growth since 2009. It grew back in October too, which was the first October growth since records began in 2007.
It gets worse.
In recent years the shrinkage from August to December has been 329,990 (2008), 94,633 (2009), 243,523 (2010), 229,851 (2011), and 71,388 (2012), which in the past has set things up nicely for the usual growth in the spring.
This time around, on the official figures the waiting list fell by only 56,824 from August to December 2013. But in December we have three Trusts missing from the data series. Their last-reported list sizes were 20655 at Barking, 14861 at The Whittington, and 24392 at Barnet and Chase Farm: a total of 59,906.
So it looks like the waiting list may not have shrunk at all from August to December 2013. It may even have grown. And that spells trouble.

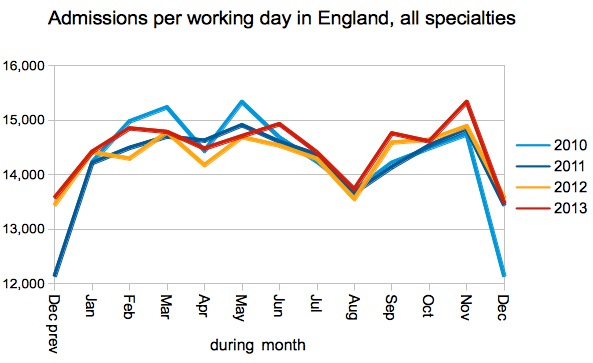
After a slight surge in November, admissions were back at their usual levels in December. Which, given the evidence of a growing waiting list, is plainly not enough.
Ultra-long waits ticked up, but the big gains of 2012 are still preserved. The one-year-waits figure excludes the three Trusts who did not report data in December, and the numbers they last reported were: Barnet and Chase Farm 182 (Sep’13), The Whittington 22 (Aug’13), Barking Havering and Redbridge 0 (Nov’13).
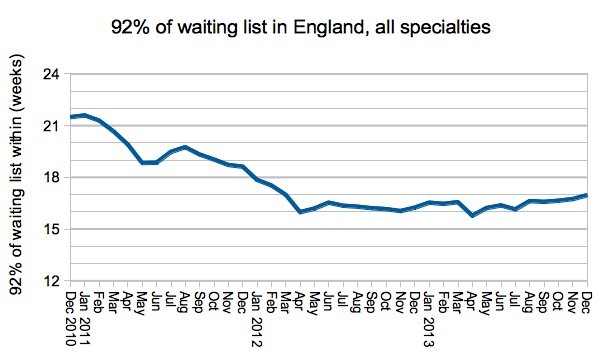
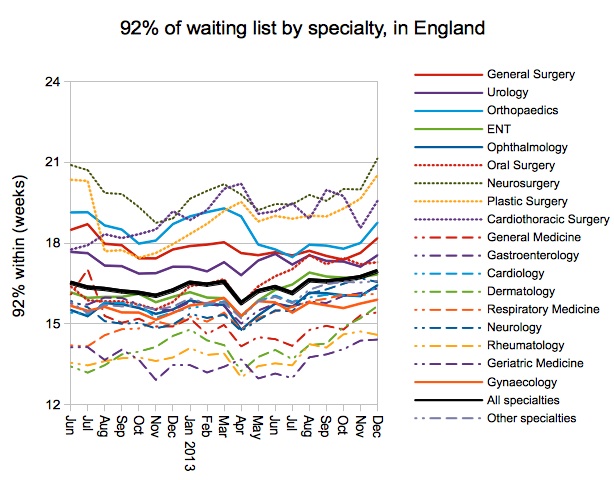
The position on the main 18-week target has slipped again, and this is starting to look like a steady decline.
At specialty level, General Surgery and Orthopaedics slipped back decisively into failure.
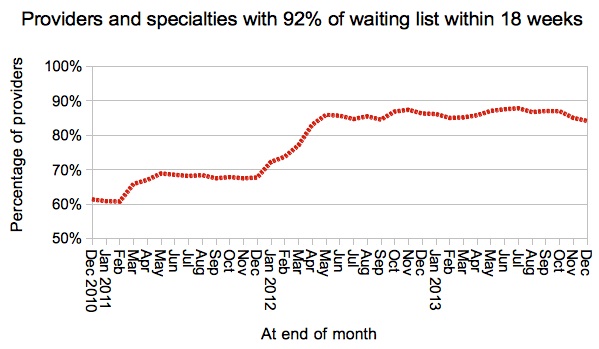
The proportion of breach specialties at Trust level deteriorated slightly. Failure remains concentrated in a minority of services.
Provider top twenty
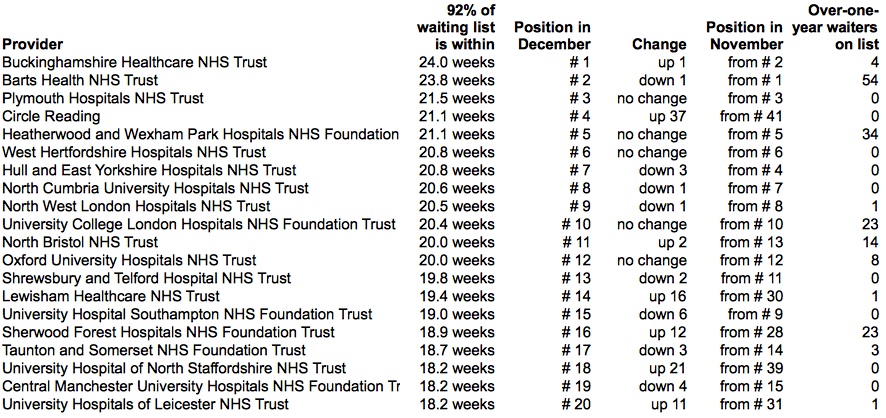
There’s a bit of scrambling at the top of the table, with a surprise new entry from Circle Reading who go straight in at number 4. This list of course excludes the three Trusts who did not report data: Barnet and Chase Farm, The Whittington, and Barking, Havering and Redbridge.
Only 33 Trusts reported any one-year-waiters, down from 38 the previous month, and these ultra-long-waiters are now concentrated in just a few Trusts: Kings had 80, Barts 54, Heatherwood and Wexham Park 34, Sherwood Forest 23, UCLH 23, and Alder Hey had 15. Just three independent sector providers reported one-year-waits: one each at Fitzwilliam, Aspen Holly House, and Ashtead.
Finally, congratulations to Croydon Health Services for dropping out of the table, going from 18th to 51st position (improving 92% waiting times from 18.0 to 17.4 weeks).
The January 2014 data is due out at 9:30am on Thursday 20 March 2014.
Return to Post Index
Leave a Reply
You must be logged in to post a comment.