England still (probably) breaching 18 weeks
19/01/2016by Rob Findlay
According to the latest official figures, the NHS in England achieved the 18 week referral-to-treatment (RTT) waiting times target at the end of November. The reported data says that 92.4 per cent of waiting list patients had waited less than 18 weeks, which is better than the target of 92 per cent.
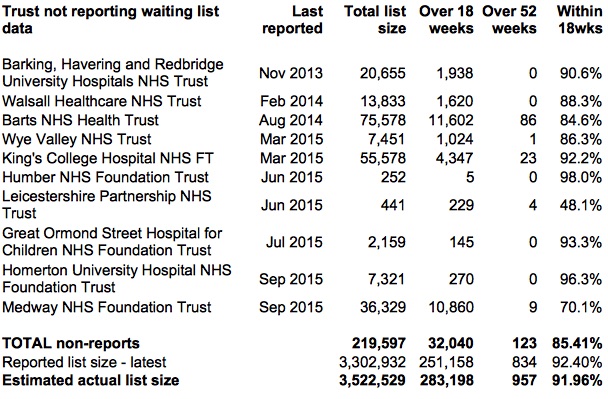
However several Trusts did not report their waiting list figures. If you add their last known positions back in, then the target was narrowly missed at 91.96 per cent. So 18 weeks was (probably) breached in November, just as it was in October.
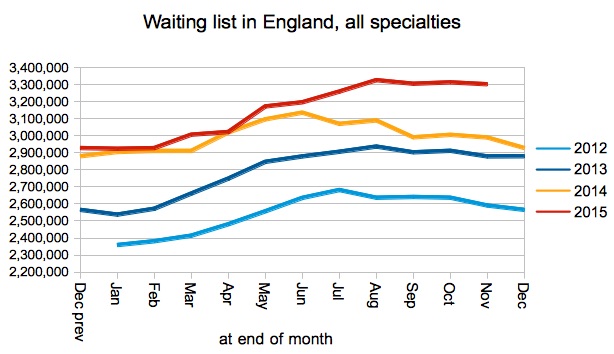
Note that these breaches predate both the junior doctors’ strike and the Christmas-time instructions to free up elective beds. What has happened is that the English waiting list has been growing by around 1,100 patients per working day since 2012, and a longer queue means longer waits. So the breach was inevitable. It is also worth noting that the 3,300-odd admissions which were cancelled during the recent junior doctors’ strike are a drop in the ocean compared with this underlying trend of rapid waiting list growth.
In the following analysis, all figures come from NHS England. If you have a national statistic that you’d like to check up on, you can download our Gooroo NHS waiting times fact checker.
England-wide picture
If you ignore non-reporting Trusts then the 18 week “incomplete pathways” target was narrowly met.
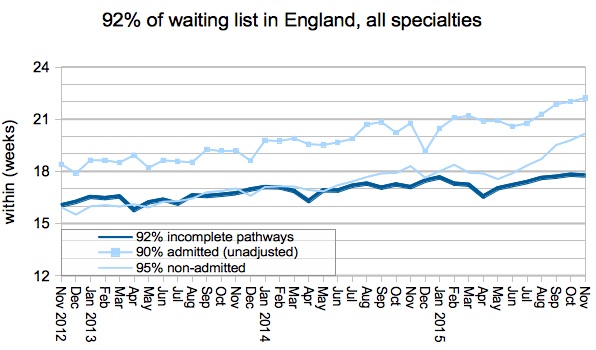
However several Trusts did not report their data, and between them they push the England-wide figures narrowly into breach, according to their last known positions.
This effect is acknowledged in the official Statistical Press Notice, albeit in a rather roundabout way. How many sleights of hand can you spot in this explanation (at the top of page 10)?
“For example, Medway NHS Foundation Trust was unable to submit data for October or November 2015. At the end of September 2015, 70.1 per cent of patients waiting to start treatment at Medway NHS Foundation Trust were waiting up to 18 weeks. The impact of removing the figures for this trust from the published September 2015 England-level figure of 92.5% of incomplete pathways within 18 weeks is an increase of 0.25 percentage points to 92.8%.”
As Sir Humphrey might have said: “Well, Minister… obviously you don’t want to admit that the target was really breached. So may I suggest that you illustrate the problem using September’s data, when the target was achieved either way. Then show the adjustments based on only one hospital to minimise the effect. And present the adjustment in the reverse sense, so that the figures appear to improve. That way you can be open and transparent, and make failure look like success. I think that should do it. Shall I draft something for your box this evening?”
Here is the complete adjustment for non-reporting Trusts:
And now, back to the reported figures…
The waiting list (incomplete pathways) has been growing rapidly since 2012, and this is the main reason why waiting times have been going up. There was an effort to hold things down before the General Election, but all those gains have now slipped away.
How fast is the waiting list growing? Back in November 2012 there were only 2,590,737 patients on the waiting list, and now there are 3,302,932 (based on the reported figures). That’s an average growth of nearly 240,000 patients per year, or nearly 20,000 per month, or nearly 1,000 per working day. If you take a trend across all the monthly data, and adjust for non-reporting Trusts, then I reckon it’s actually about 10% higher than that. However you slice it, though, it’s rapid growth and it needs to be reversed if the NHS Constitution rights on elective access are to be restored.

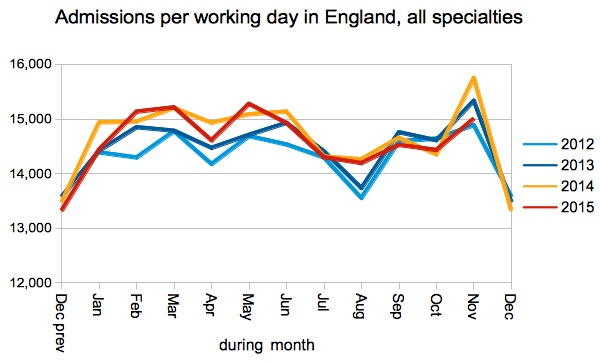
Why has the waiting list been growing? Demand is rising, but admissions (in the shape of admitted clock stops) are not.
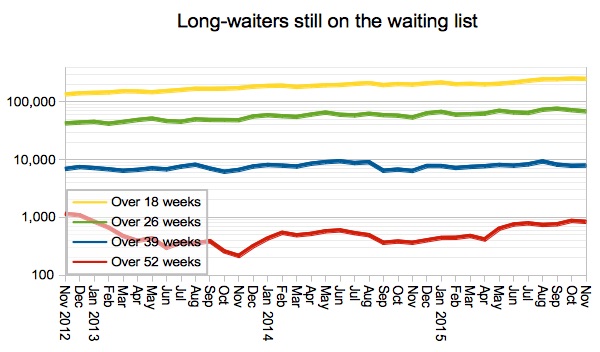
In a rare glimmer of better news, long waits improved slightly on the previous month’s figures. This is a like-for-like comparison too, because the same Trusts did not report data in both months.
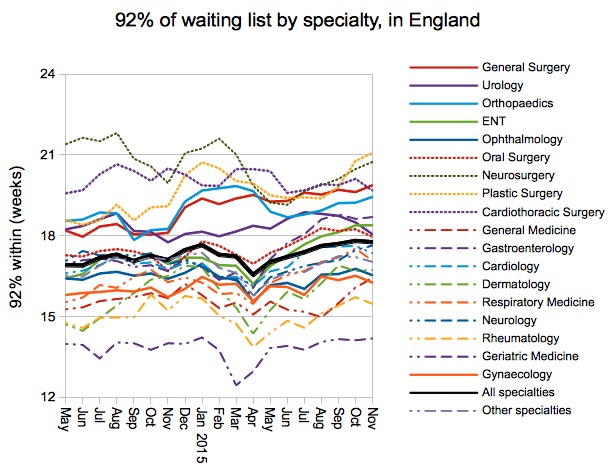
Overall 92nd centile waiting times were about the same as in October, and it was a mixed bag at specialty level with some specialties improving (notably Urology) and others getting worse (notably Neurosurgery and Plastic Surgery).
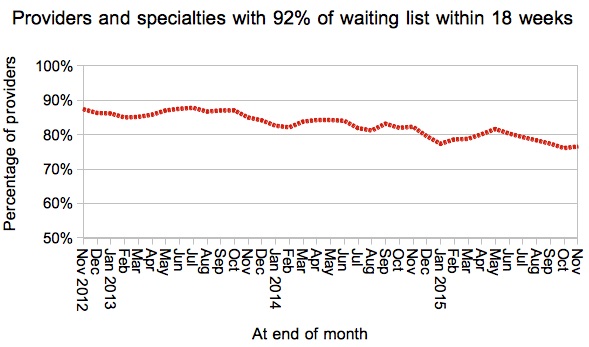
Going down to individual specialties within Trusts now, 76.5 per cent of these local services achieved 18 weeks which is a small improvement on October’s figure of 76.1 per cent.
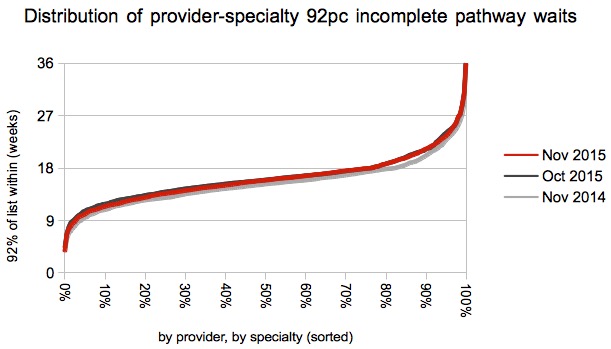
Most of the improvement in waiting times was seen at the shorter-waiting end of the spectrum, however.
Local detail
We’ve done some interactive maps showing the waiting times position by specialty for every Trust and CCG with significant numbers of admissions. If you want to look your own Trust up quickly, then visit our 18-weeks reports page.
Kettering General Hospital NHS Foundation Trust have shot to the top of the table this month, jumping 14 places and adding more than 8 weeks to their 92nd centile waiting times. How do you add 8 weeks to your waiting times, in only a month? There is a clue in their Board papers: “The Trust continues to have concerns with regard to its data quality which may result in amendments to its reported position”. Acknowledging the problem and knuckling down to fix it – that’s the way to do it, and let’s hope they succeed.
The Princess Alexandra Hospital NHS Trust, who only resumed reporting in October, have already improved their waiting times by more than 3 weeks and moved down to third place in the table – well done the PAH.
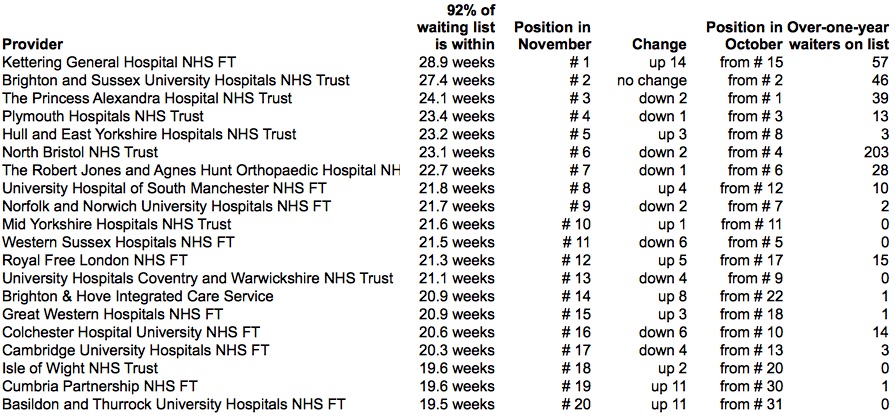
Three Trusts dropped out of the table, but only Worcestershire Acute Hospitals NHS Trust also managed to get their waiting times below 18 weeks at the same time – well done them as well. [Although I have been reminded in the Comments on the HSJ website that this has been helped along by a 3 month freeze on referrals.]
Data for December is due out at 9:30am on 11 February 2016.
Return to Post Index
Leave a Reply
You must be logged in to post a comment.