
England remains solidly in breach of 18 weeks as new incentives loom
16/08/2016by Rob Findlay
England’s “18 weeks” performance went further into breach in June, especially in those local services that were already worse than target.
This is the opposite of what was meant to happen. Breaching specialties were supposed to be improving their waiting times to reach the start of their challenging “reset” trajectories; these kick in at the end of July with financial incentives attached.
Why are things getting worse? The national waiting list continues to grow rapidly year-on-year, and the lengthening queue is overwhelming Trusts’ efforts to manage their way to shorter waiting times. It boils down to a chronic mismatch between activity and demand, and activity is plainly not keeping up.
In the following analysis, all figures come from NHS England. If you have a national statistic that you’d like to check up on, you can download our Gooroo NHS waiting times fact checker.
England-wide picture
Performance against the headline “92 per cent within 18 weeks” target slipped in June, according to the published figures.
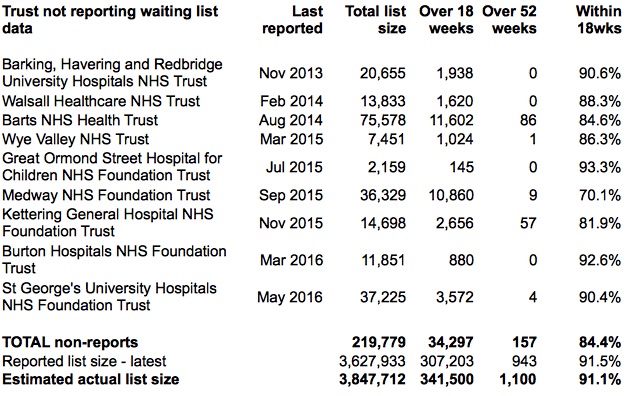
If you add in the last-known positions at non-reporting Trusts, things were even worse with only 91.1 per cent of the waiting list within 18 weeks, down from 91.4 per cent at the end of May. (All the other charts in this report are based on the published data, which excludes non-reporting Trusts.)
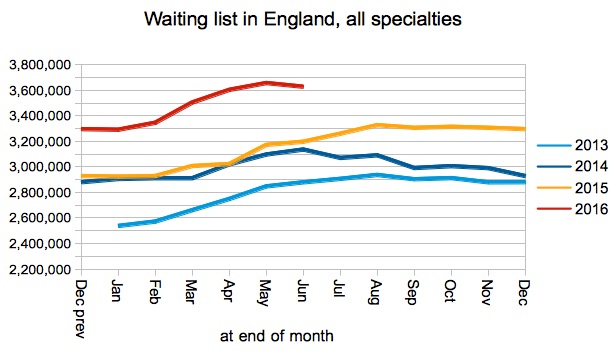
According to the published figures, the waiting list shrank slightly in June. But this is an artefact of St George’s University Hospitals NHS Foundation Trust dropping out of the data – if you add them back in then the English waiting list grew by 8,400 patients which is typical for June.
So, contrary to the appearance of the chart below, the gap between the 2016 and 2015 waiting list sizes remains as large as ever.
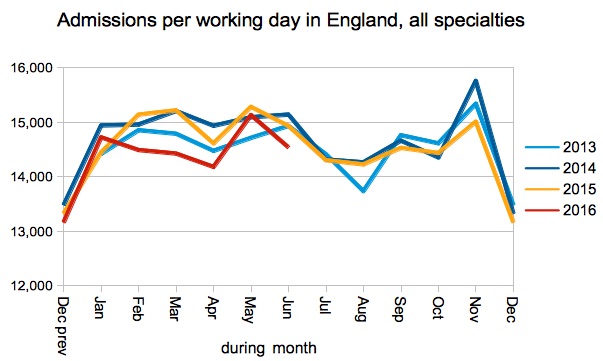
Admissions per working day were down on recent years, even if you add back in the 100 patients per working day missing from the St George’s data. The growing waiting list is the result of a gap between activity and demand, and this low rate of admissions is not helping. I am guessing (but haven’t checked) that elective work may be being squeezed out by rising emergency activity.
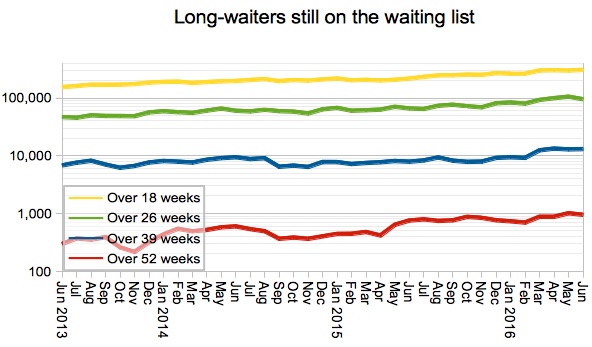
Long-waits are broadly stable on the official figures, although the statistics for over-one-year waiters are likely to be well short of reality because of non-reporting Trusts.
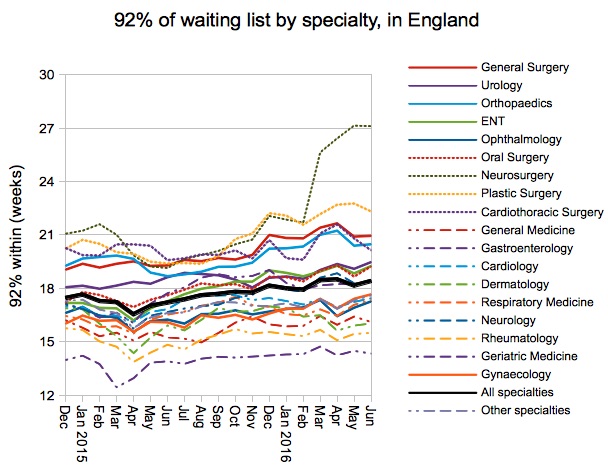
Waiting times went up in every surgical specialty except Neurosurgery and Plastic Surgery. The only surgical specialties that are achieving 18 weeks at national level, Ophthalmology and Gynaecology, deteriorated sharply and are now approaching breach.
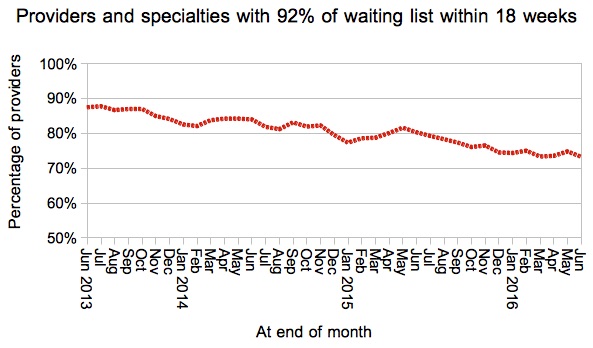
The proportion of local services (at Trust-specialty level) achieving 18 weeks fell in June to 73.26 per cent, which is the worst performance since January 2012 (when the incomplete pathways target was first achieved).
This is striking, because it is the opposite of that is meant to be happening. Trusts have agreed trajectories for their intended 18 weeks performance, and between the end of July and the end of March these trajectories come with strong financial incentives.
Trusts have generally chosen to start their trajectories somewhere between their May performance and the 92 per cent target, which means that ‘breaching’ Trusts have a challenging start, and ‘achieving’ Trusts have a relaxed start. So the proportion of services achieving 18 weeks should be going up, not down.
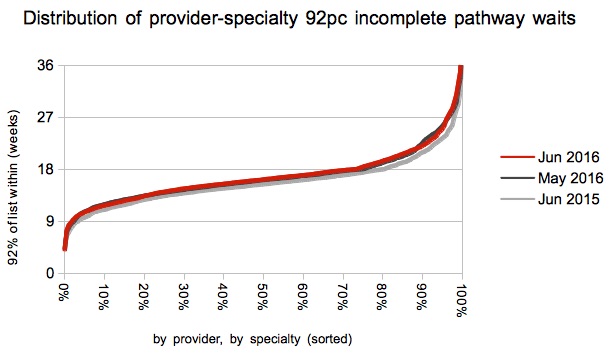
We would also expect to see improvements in waiting times being concentrated at the longer-waiting end of the distribution, but the chart below shows that those longer waits have (mostly) grown even longer. So the slippage is concentrated in precisely the places where improvement was most hoped-for.
Local detail
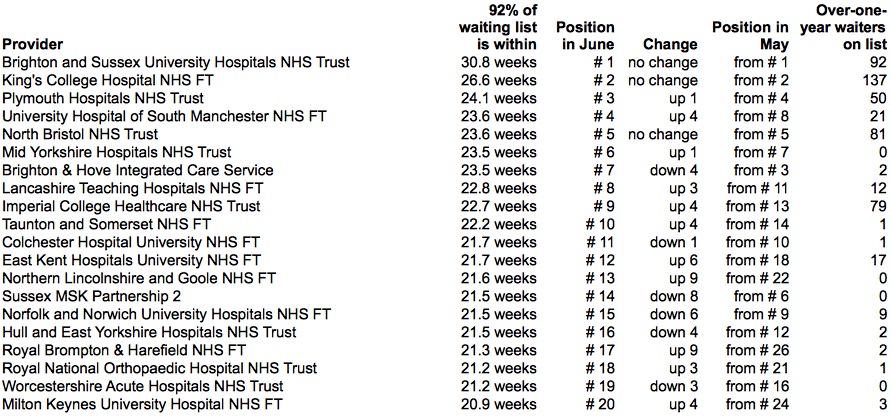
Having said that, the top three Trusts in this month’s table of long waiters all improved their waiting times slightly in June, which is excellent news.
We’ve done some interactive maps showing the waiting times position by specialty for every Trust and CCG with significant waiting lists. If you want to look your own Trust up quickly, then visit our 18-weeks reports page.
The Princess Alexandra Hospital NHS Trust has successfully dropped all the way from 15th to 31st in the rankings, with 92nd centile waits improving from 21.3 to 19.7 weeks. This is good progress towards the start of their trajectory in July, when they are expecting to be inside 18 weeks, and I wish them every success.
Data for July 2016, the first month of the incentivised “reset” trajectories, is due out at 9:30am on 8th September 2016.
Return to Post Index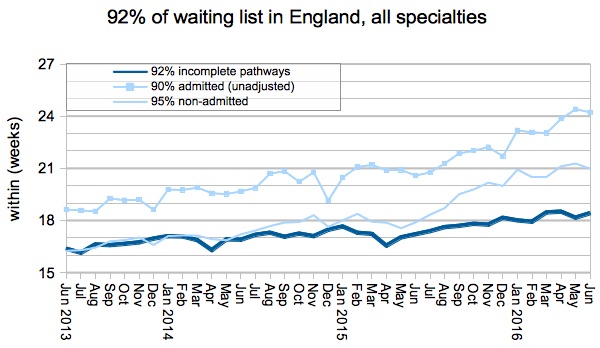
Leave a Reply
You must be logged in to post a comment.