
Gooroo Planner upgrade: tactical activity planning for operational managers
26/11/2019by Rob Findlay
We have just released an upgrade to Gooroo Planner, and it’s available now to all existing users. Here is what’s in it.
Edit week-by-week activity directly in Profiling
Now you can edit your week-by-week activity plans directly, and watch the required capacity and achievable waiting times change as you work. This will be especially useful for operational managers wanting to plan changes such as waiting list initiatives and clinician absences, or for winter.
What is new about this feature is that it changes the overall activity plan, as well as how the activity is distributed between one week and another.
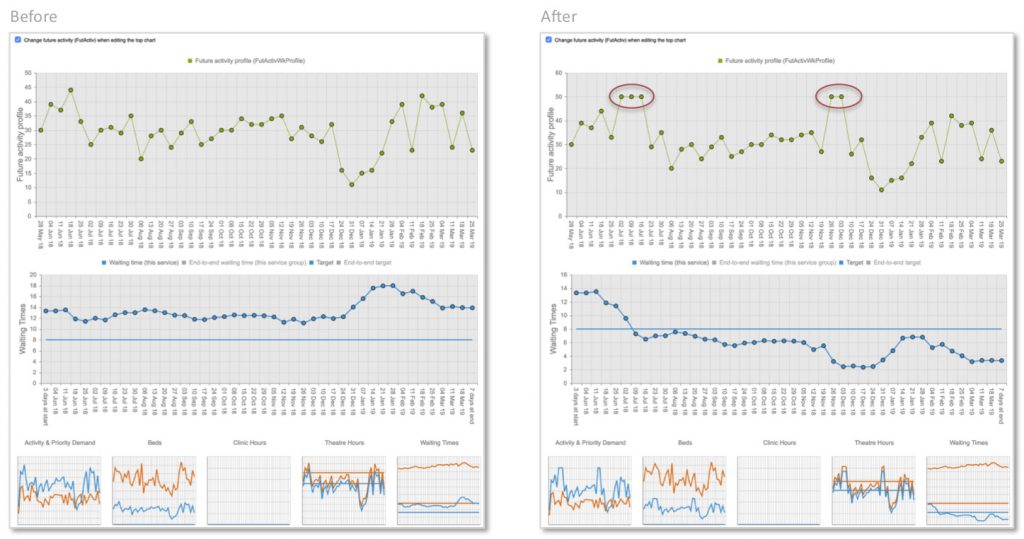
For instance, the left-hand image below shows a clinical service where the safely-achievable waiting time (shown by the wobbly line in the large blue chart) is going to be persistently higher than the intended waiting time for this service (shown by the straight blue line).
The right-hand image shows that, by adding a three-week waiting list initiative early on (the first circled activity values in the top green chart), these waits can be brought within target. Then another two-week waiting list initiative later in the year is needed to stop further breaches after the Christmas / New Year slowdown.
How do you use this new feature? I’ll explain it below, and there is also an explanatory video “Editing activity profiles” on our Gooroo Planner video page: https://video.gooroo.co.uk/
This feature is only available if your report is based on an activity plan that can be edited: i.e. the activity scenario must be ‘Use data provided (FutActiv)’. It isn’t available if the activity scenario is automatically calculated (e.g. ‘Match past activity rate’, ‘Match new demand’, or ‘Match waiting list targets’).
But if the report you want to edit uses a calculated activity scenario, then don’t worry – it’s easy enough to convert it.
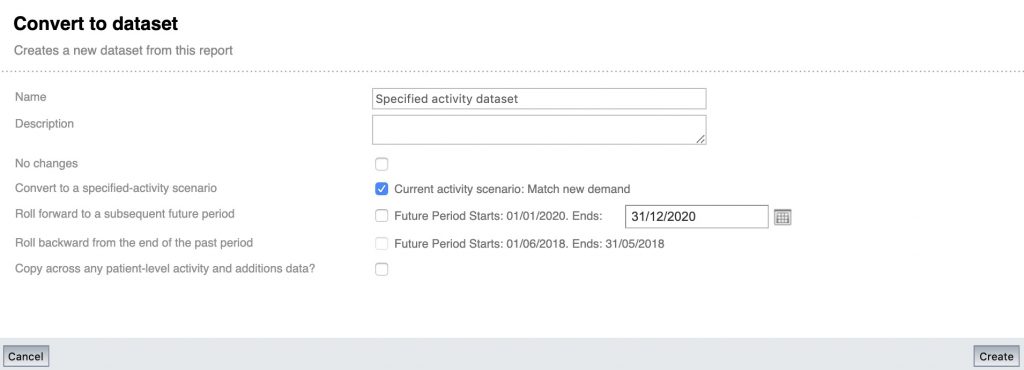
First you need to use your Gooroo Planner Professional licence to create a dataset that contains a specified activity plan (i.e. the ‘FutActiv’ field needs to be populated). The easiest way is to convert any existing report back into a dataset, with the “Convert to a specified-activity scenario” option selected (see image below). Alternatively you can update a dataset with a statistical file that contains FutActiv values for each service – for instance it might contain the activity that has been commissioned for the financial year.
Then you need to use that dataset to create a report, selecting in the Calculation Settings the future activity scenario called “Use data provided (FutActiv)” as shown below.

Open the report as usual, and click the Profiling icon above the service you want to edit. Tick the box labelled “Change future activity (FutActiv) when editing the top chart” as shown below (if it isn’t available, then your activity scenario isn’t “Use data provided (FutActiv)”).

After you tick the box, the green chart will change to be a literal representation of the activity in each full week, which you can go ahead and edit in the usual way by clicking any point.
You will see the blue activity chart below changing in lockstep as you edit the green chart, with overall activity and the final waiting time changing as you work. It even automatically adjusts if the first and last weeks are only part weeks, or if some calendar weeks appear more than once in the future period.
All your changes are temporary until you click the ‘Save changes’ button, and will be lost if you move away from the page. So if you have a lot of changes to make then you may want to save your work fairly often.
Standard licences upgraded
We have upgraded Standard licences to offer all the available functionality when you are working within a Report. That means Standard licence holders can use the new Profile editing feature described above, as well as the Editing tab in which any of the data can be changed.
A Professional licence is still needed to work with Datasets, for instance when uploading and updating Datasets, and using Datasets to create Reports.
We felt this change would help to clarify that Professional licences are intended for information and planning professionals (who are used to working with data), and Standard licences are intended more for senior and operational managers (who just want to get straight to the planning).
This is a significant increase in the power of Standard licences – which previously were ‘read only’ with no ability to edit in the Profiling or Editing tabs. We have therefore changed the price to £2,000+VAT per user per year, which is half the price of a Professional licence. The change will be applied when Standard licences come up for renewal.
Simpler controls in the Profiling and Editing tabs
The old service selection controls in Profiling and Editing were rather clunky, so we’ve improved them.
Now there is a simple drop-down containing all the filtered-in services, and you can even scroll through them with up and down buttons.
You can re-use dataset and report names
You are now able to re-use dataset and report names, and this is mainly for the benefit of Planner API users.
If you are a Planner API user, you have almost certainly set your configuration file to ‘GenerateSuffix’ so that every dataset and report name is always unique. But this created two problems.
Firstly, it meant that all the downloaded files had unpredictable names which made it more difficult for Business Intelligence systems to collect them automatically. Secondly, it meant that large numbers of datasets and reports would accumulate in your Gooroo account even if the old ones were not needed any more.
This has now changed. If you set ‘GenerateSuffix’ to ‘false’, then the Gooroo Planner API will automatically overwrite the previous dataset and reports that have the same name. And the downloaded files will have the exact name you chose, making Business Intelligence integration easier.
You can re-use names when working via the web interface too – Gooroo Planner will ask you if you want to replace what is already there.
Faster processing by dropping patient-level data
Whenever you create a report, or convert or copy datasets and reports, Gooroo Planner will now ask you whether you want to ‘Copy across any patient-level activity and additions data?’.

If you tick the box, then all that patient-level data will be copied over and all the functionality you are used to will be preserved.
If you leave it unticked (the default) then all the statistical data and any patient-level waiting list data will be copied over, but the bulkier patient-level activity and additions data will not. This improves processing time and saves on storage, and the only functionality you lose is the Capacity tab in Reports.
To copy patient-level activity and additions data over to your report when using the Planner API, use the new setting <RetainPatientLevelData>true</RetainPatientLevelData> within the <Report> section. If this setting is omitted or false then patient-level activity and additions data will be in the dataset but not the report (and patient-level waiting list data will always be copied).
Multiple delete
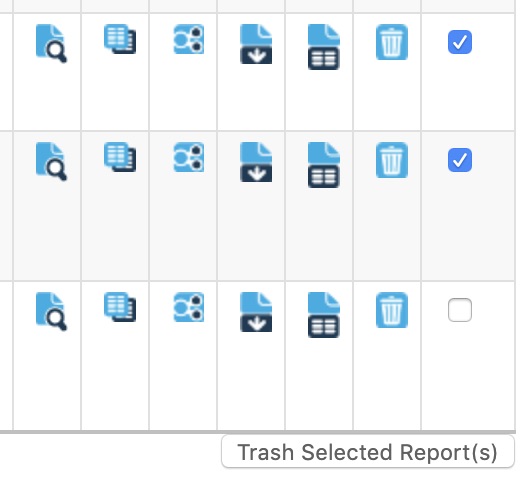
The dataset and report managers now provide a multiple delete function. Just tick the boxes beside the datasets/reports you want to delete, and click the Trash… control at the bottom.
Grand totalling in Report view
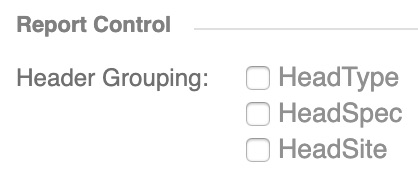
When viewing a report in the main Report tab, there is a control that allows you to subtotal by different headers so that you can quickly see (for instance) subtotals by specialty or point of deliver.
This has been enhanced to allow grand totalling. Just until all the boxes and click Go to get the totals across every service in the model.
Handy tooltips in Report view
Hover the mouse over a row label in the main Report view, and you’ll see the field name that it’s based on. This is especially handy if you’ve edited the text in that report style, and can’t remember exactly which field it was.
There are inevitably various bug fixes too…
Beefier database server
We’ve moved our main database to its own brand-new server, and it’s a beast: 20 processor cores, 64GB of memory, and solid state drives.
And did you know…?
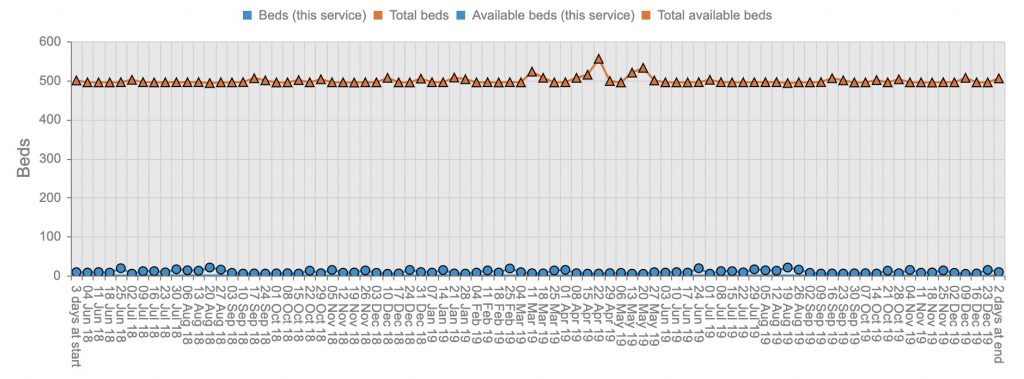
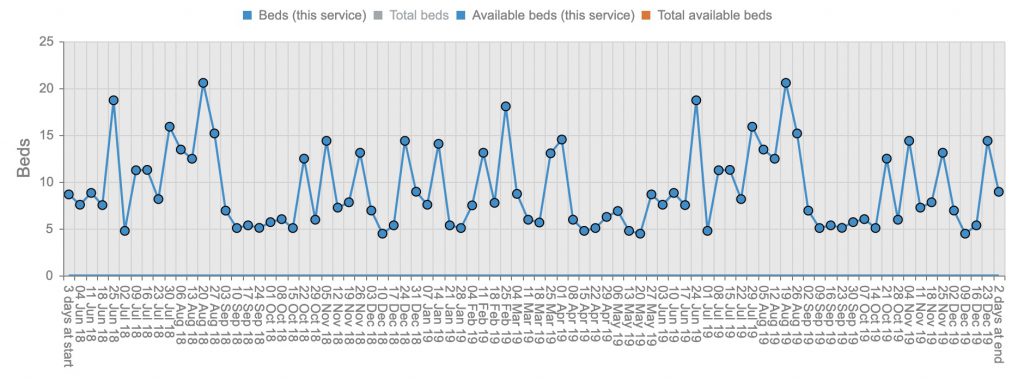
…that you can make lines disappear in the Profiling charts, by clicking the legend? I didn’t, until one of our developers shows me, and apparently it’s always been like this.
This is very useful if the orange ‘total’ line is expanding the scale so far that you can hardly see the blue line for the service you’re interested in.
Leave a Reply
You must be logged in to post a comment.