Calculating bed occupancy and risk – hour by hour variation
06/02/2019by Rob Findlay
In the previous article we calculated bed occupancy, based on the acceptable risk of running out of beds, and the way that non-elective demand varies from week to week in any particular bed pool.
But that isn’t the whole picture, because non-elective bed usage also varies by the time of day, and day of the week, which we will refer to as ‘intra-week variation’. We need to take account of that too.
Strong predictable cycle
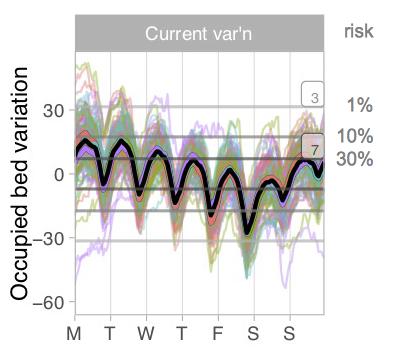
The chart below shows the intra-week variation in occupied non-elective beds (i.e. admissions minus discharges) in a particular adult general and acute bed pool.
The heavy black line in the middle shows what happens on average, and it is a strong and predictable cycle.
Every day, the beds fill up and then empty out. This is because admissions are fairly steady throughout the day (except in the small hours of the morning), but most discharges happen in the late afternoon with a peak around 6pm. So beds are fullest with non-elective patients in the middle of the day.
We can also see that beds tend to empty out during the working week and fill up at the weekend. This is because, although the rate of admissions is lower at weekends, the rate of discharges is even lower, so the net effect is for beds to fill up with non-elective patients on Saturdays and Sundays. The emptying out during the working week is the converse of this effect.
The heavy black line shows the average pattern, but what about the variation?
Also highly variable
Each individual week (over a two year period) is shown by a different coloured line in the chart, and each of those lines has been zero-based because we have already taken week-by-week variation into account in the previous article.
Each week’s line has been coloured according to the calendar quarter in which it began. There are also heavy lines showing the average for that quarter; the fact that they are hard to see shows that intra-week variation does not vary much from season to season.
There are a few extreme lines going from top left to bottom right (the weeks before each Christmas), and from bottom left to top right (the weeks after each Christmas). But even if we ignore those, we can see that one week is very different from another – even though we have already zero-based them all.
So we have a strong, regular cycle, as well as random variation – in other words, we have both predictable and unpredictable variation. Which of them should we take into account when calculating bed occupancy?
The level of risk
Again, it depends on whether we can manage the predictable variation. On the assumption that we are not literally going to open and close beds hour by hour and day by day, we need to maintain a low enough bed occupancy to absorb the predictable as well as the unpredictable variation. (And if you don’t like that assumption, it turns out to make surprisingly little difference anyway, as we will see in the next article.)
The risk lines have therefore been drawn straight across the chart, and we are now ready to look at the relationship between risk and bed occupancy for this intra-week variation. If we make enough extra beds available to satisfy the top grey line, then there will be a 1 per cent risk of running out of beds based on the intra-week variation. The next two grey lines show the extra beds associated with 10 per cent and 30 per cent risk.
Finally, we need to combine these intra-week risks with the week-by-week variations examined in the previous article (on the basis that the variations are not correlated, which they aren’t).
The right bed occupancy
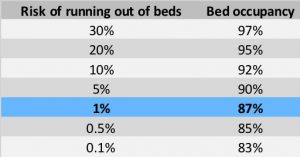
The end result is the overall relationship between the risk of running out of beds, and bed occupancy, for this particular pool of adult general and acute beds. It is summarised in the table below.
If the acceptable risk of running out of these beds is a few per cent, then it is apparent that the popular figure of 85 per cent bed occupancy would be unnecessarily low and achieving it would be an unnecessary use of resources. On the other hand the more recently cited figure of 92 per cent would be too high and present an unacceptable risk of running out of beds.
In today’s NHS, however, real bed occupancies are often much higher than either figure. The table shows that if bed occupancy were 95 per cent in this example then there would be insufficient non-elective beds about 20 per cent of the time, with the familiar consequences of frequently cancelled elective surgery, widespread outliers in other parts of the hospital, and increased clinical risks.
Such high risks are clearly unacceptable. But it may not be possible to open more beds. So in the next article we will look at what else we can do.
I would like to thank the Emergency Care Intensive Support Team at NHS Improvement for their helpful suggestions during the preparation of these articles, Piotr Fryzlewicz, Professor of Statistics at the London School of Economics, for reviewing and advising on the statistical methods used, and those acute hospitals in England and Scotland who helped to pilot the methods.
We can calculate the relationship between bed occupancy and risk for your acute hospital – please get in touch if you are interested.
Return to Post Index

Leave a Reply
You must be logged in to post a comment.