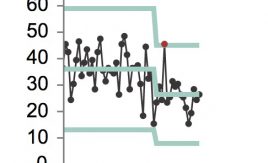
Introducing monthly A&E control charts
The 4-hour A&E target is the highest profile performance target in the English NHS. We analyse every Trust's performance each month using control charts, and this is an introduction.
Filter blog posts
You can filter out our blog posts below by a category relevant to yourself.

The 4-hour A&E target is the highest profile performance target in the English NHS. We analyse every Trust's performance each month using control charts, and this is an introduction.

Everybody agrees that clinical priorities should come first. Why does this principle break down when it comes to follow-up outpatients?
Is your bed flow designed to deliver regular crises? Is theatre performance stable? Control charts analyse your bed, theatre and clinic capacity for different days of the week, so that you can tell what was expected performance and what was unusual.

Cancer pathways are complex. But you still need to model the capacity needed to achieve short waiting times. Here's how to do it, with Gooroo Planner.

Winter: season of full beds, cancelled theatre sessions, and frustrated surgeons. With a bit of careful planning, it doesn't have to be like this.
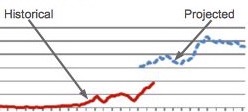
How many patients are expected to breach the target every week? It's a good question. To answer it, you need to understand how patients are being scheduled.

How late is a "late start" in your operating theatres? If I told you they probably cost something like £20 a minute, how late is a "late start" now?

Lower costs, more activity, and less fire-fighting. That's the power of planning electives and non-electives together, to achieve access standards for both, right across the hospital.
The Overview is a powerful visualisation, so that you can quickly and expertly spot the opportunities to make better use of your theatres and clinics. This post helps you interpret it.
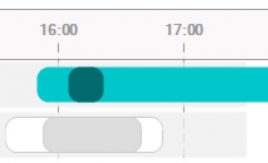
The Detail view lays out what happened in theatre or clinic, every minute of the day. This is how to interpret it.