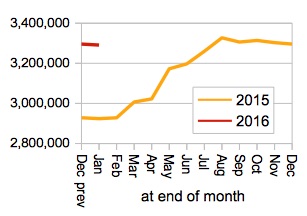
English waiting list grew by over 12 per cent year-on-year
14/03/2016by Rob Findlay
England officially missed the 18 week target by the narrowest of margins at the end of January – just one patient per Trust. The breach was so narrow that the official Statistical Press Notice was obliged to report “92.0 per cent (91.995% to 3 decimal places) of patients waiting to start treatment (incomplete pathways) were waiting up to 18 weeks”.
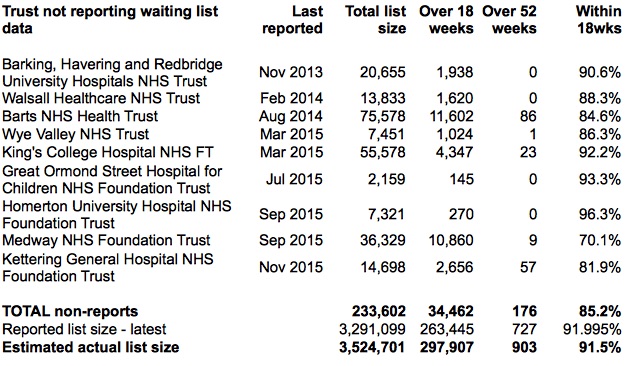
Unofficially, though, the figures were considerably worse. If we add back in the last-reported positions at non-reporting Trusts, only 91.5 per cent of waiting list patients were within 18 weeks.
Even this is only an estimate, and probably not a very good one: we know for instance that Barking, Havering and Redbridge University Hospitals NHS Trust has recently counted some 1,015 one-year-waiters on its lists, compared with a last-reported position of zero one-year waiters. So the official statement that “727 patients were waiting more than 52 weeks” is clearly just plain wrong, and the official near-miss on 18 weeks must also be considered unreliable.
In the following analysis, all figures come from NHS England. If you have a national statistic that you’d like to check up on, you can download our Gooroo NHS waiting times fact checker.
England-wide picture
January’s improvement in 18 week waits was a surprise, because usually patient scheduling is relatively poor after New Year and long-waits go up as a result. This year bucked the trend because the NHS pulled out the stops to treat as many long-waiting patients as possible (shown in the chart below by the long waiting times of patients chosen for treatment for admitted and non-admitted care – the longest since 2008).
Taken in isolation, treating long waiters is a good thing – better than keeping them waiting. However it is possible to have too much of a good thing, if it means keeping clinically urgent patients waiting in order to release capacity for those long-waiters. The bigger the waiting list, the harder it is to achieve the waiting time target, and the greater the temptation to delay urgent patients to get those long-waiters treated. But clinical priorities should always come first.
The official statistics (which are used in all these charts) don’t tell the whole story, and we can have a stab at a more realistic picture by adding back in the last-known positions at non-reporting Trusts. However some of these Trusts have not reported for ages, and (as noted above) Barking, Havering and Redbridge University Hospitals NHS Trust alone has recently counted over a thousand one-year waiters on its lists. So the estimated position below should probably also be regarded as somewhat optimistic.
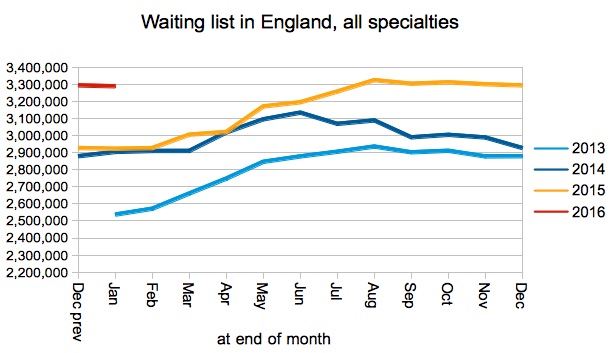
The number of patients waiting was steady during January, which is normal for the season. However the year-on-year growth was huge at 367,000 patients (on the official figures), which is over 12 per cent. Increases in waiting times are inevitable when the queue is lengthening so rapidly.
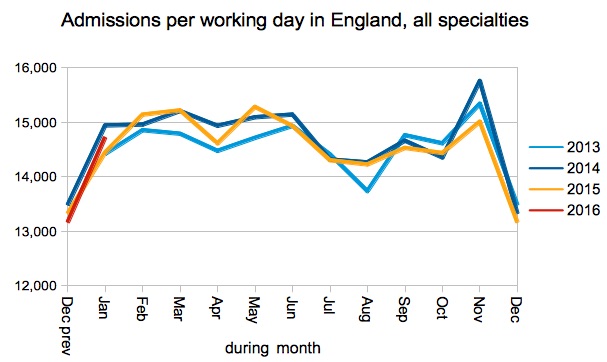
Admissions per working day were flat on recent years (again). Which plainly isn’t enough to stop the waiting list from growing.
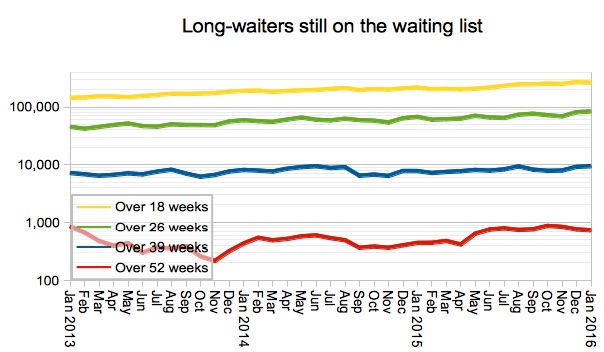
For what it’s worth, here are the official figures on long-waiters. But we can’t actually believe them, because so many more patients are waiting at non-reporting Trusts.
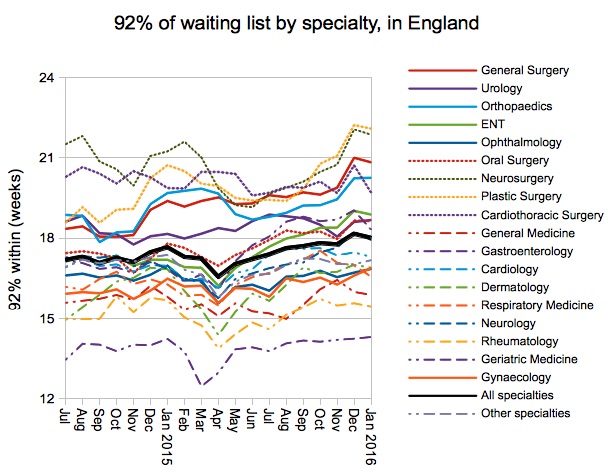
The improvement in waiting times was uneven across the specialties, with long-waiting surgical specialties generally improving and short-waiting ones deteriorating. Among the medical specialties, Neurology edged back inside 18 weeks.
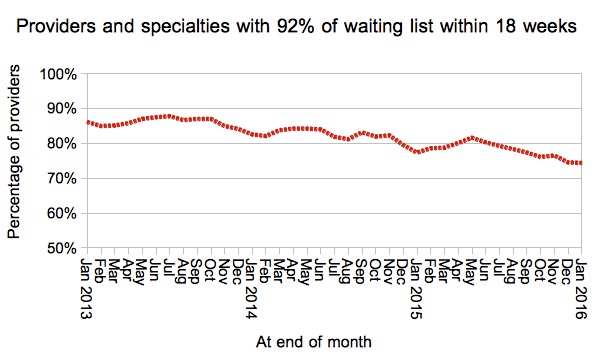
The proportion of local services achieving 18 weeks (at Trust-specialty level) deteriorated very slightly in January.
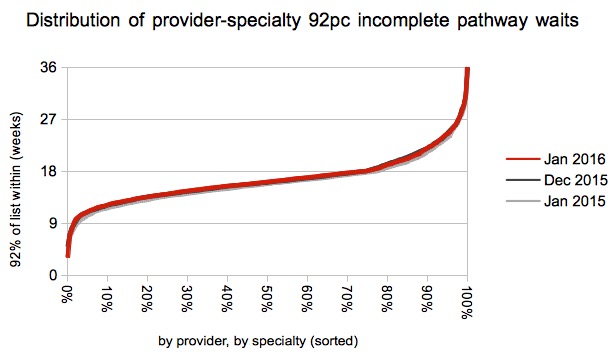
Waiting times at local service level converged slightly on 18 weeks, with long waits improving and short waits deteriorating slightly, consistent with the picture at specialty level.
Local detail
We’ve done some interactive maps showing the waiting times position by specialty for every Trust and CCG with significant numbers of admissions. If you want to look your own Trust up quickly, then visit our 18-weeks reports page.
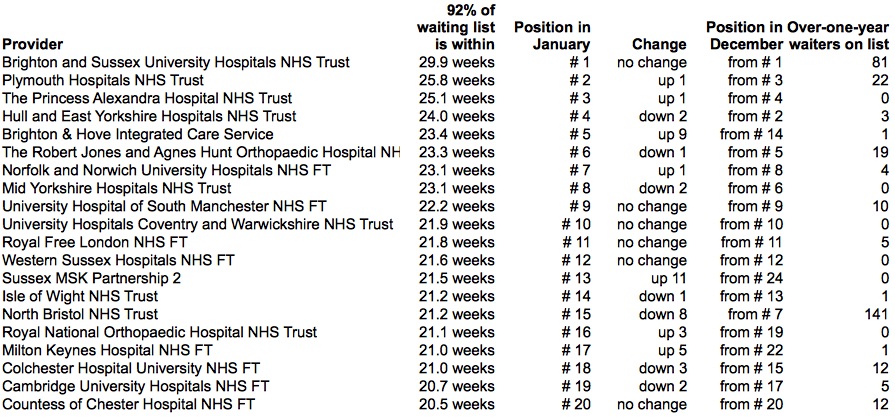
Brighton and Sussex University Hospitals NHS Trust remain at the top of the table with unchanged waiting times of 29.9 weeks, and waiting times lengthened at two of their nearby providers as well: Brighton & Hove Integrated Care Service and Sussex MSK Partnership.
North Bristol NHS Trust have improved their position, and made some inroads into their one-year waits too, so congratulations to them.
Data for February 2016 is due out at 9:30am on14th April. I am anticipating another breach of 18 weeks (if non-reporting Trusts are added back in), followed by a recovery of 18 weeks in the March figures. But then waiting times are full of surprises.
Return to Post Index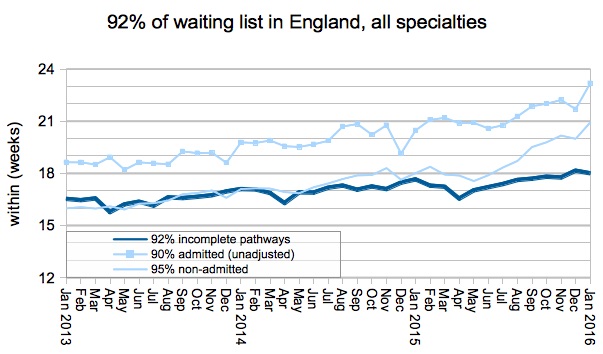
Leave a Reply
You must be logged in to post a comment.