
Covid-19 planning part 1 – the shutdown
18/03/2020by Rob Findlay
This blog post focuses on modelling an elective shutdown during the covid peak, using Gooroo Planner. As of May 2020 it is no longer being updated. A subsequent post focuses on modelling the recovery.
Non-elective demand related to covid-19
Non-elective respiratory demand is going to be tricky to model because covid-19 does not appear in most of your historical data, so there is no reliable baseline demand to measure.
You will therefore want to ensure that your historical data is drawn entirely from the pre-covid-19 period for consistency, and make assumptions about the effect of covid-19. Public Health may be able to help you.
The statistical fields PastExtraDem (past extra demand, to be added to the measured past demand) or FutExtraDem (future extra demand) are probably the best ones to use to add demand. PastExtraDem might be easier because you don’t need to change it if you change the length of the future period.
You can also amend the week-by-week profile of demand for respiratory non-electives using DemandWkProfile01-53, if you like.
Elective shutdown during covid-19
You will want to consider whether elective demand (arising from GP referrals etc) is likely to change during covid-19. You can use Growth, PastExtraDem and FutExtraDem to factor-in any changes.
Alternatively you can filter your historical data at patient level, if you think particular kinds of patient will be absent from demand; this effectively rewrites the past so that it’s on the same basis as your expected future.
You may choose to leave new outpatient demand unchanged, on the basis that demand will still be building up in the community even if GPs aren’t necessarily referring it in. In that case, you would leave the historical data uploads unchanged.
So that’s the broad picture on demand. However you also have a choice about how to respond to that demand, because of patients who are referred as routine but turn out to be urgent.
‘Routine’ referrals who turn out to be urgent (if seen)
Gooroo Planner cascades elective demand along the clinical pathway. It is capable of handling complex pathways, but in most of your implementations this simply means converting new outpatient activity into admitted patient demand at the historic conversion rate.
It calculates urgent admitted demand as a proportion of all outpatient activity (as opposed to converting only urgent outpatient activity into urgent admitted demand). This is because many admitted patients who are graded ‘urgent’ were originally referred as routine outpatients.
If you stop seeing routine outpatients, you will miss a lot of patients who are actually urgent but haven’t yet been identified as such.
So you have a choice of scenario, depending on how you want to manage those new outpatients who are referred as routine but (if seen) would turn out actually to be urgent:
a) You could see only urgent referrals in outpatients, and then admit only those conversions who are confirmed as being urgent. This is the most restrictive scenario. Any patients who were referred as routine, but are actually urgent, would be left unseen on the waiting list (at serious clinical risk).
To model this scenario, follow steps 1-5 below but apply step 2 only to new outpatients; then repeat step 2 for the admitted patient services (elective inpatients and daycases) and carry on to repeat steps 3-5.
b) You could see all referrals in outpatients, and then admit only those conversions who are confirmed as being urgent. That would remove the clinical risk identified in option a) above.
To model this scenario, follow steps 1-5 below, but apply step 2 only to admitted patient services. If you are only restricting inpatient admissions, then apply step 2 to inpatient electives only.
c) You could see only urgent referrals in outpatients, but assume that any routine referrals who are actually urgent are picked up by some other means and somehow find their way onto the admitted patient waiting list as urgent.
To model this (far-fetched?) scenario, follow steps 1-5 below for all elective services at once.
The steps referred to above are:
1) Create a report in the usual way, selecting the “Match new demand” activity scenario.
2) Download that report from the report manager (using the 4th icon), open it in Excel, and delete all columns except the headers at the start (HeadType, HeadSpec etc) and ResPriDemand (which you will find somewhere around column BU in Excel if you downloaded the file from the web, or column CD if you are using the file returned by the API). Change the column title ResPriDemand to FutActiv because this is going to be your new activity plan. Save the file as CSV.
3) Convert the report into a dataset, using the control in the report manager (5th icon along), selecting “Convert to a specified-activity scenario”.
4) Update that dataset with the file you created at step 2, selecting “overwrite”.
5) Create a report from the updated dataset, leaving the FutActiv scenario selected. This is your urgent-only activity plan. It is also the report you will use if you now need to repeat steps 2-5.
Recovery after covid-19
When you have finished planning the shutdown, you will want to plan the recovery. This part is easier to model.
In the Reports manager, click the “Convert to dataset” icon (5th one along) and select the option “Roll forward to a subsequent future period”, choosing the date when you want the recovery to end (which may be a few years into the future). Don’t worry if you want to change this date later on, because you can do that by changing the future period end date in the Calculation Settings when you create a new report.
If you haven’t already done so, update this new dataset with the waiting time and/or waiting list targets you want to achieve. Then use it to create a report, selecting the activity scenario “Future activity should: … Match waiting list targets”.
Understanding the results
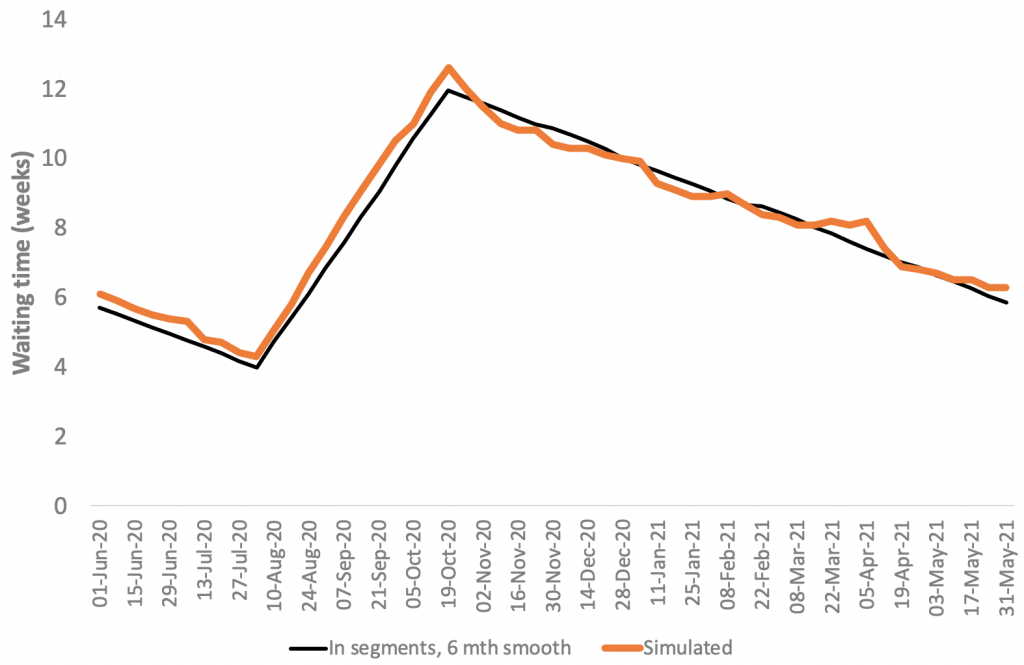
Gooroo Planner allows you to cross-check the calculated waiting time results with a patient-level simulation of your scenario – a very stern test of any model of this kind.
When you look at the waiting time profile for new outpatients, it should look credible and compare well against the simulator. The chart below shows an example, profiling waiting times before, during and after an urgent-only ‘shutdown’ (i.e. the most restrictive scenario a) above). Don’t worry too much about the dates – this is not intended to reflect the real timings of covid-19.
However when you look at elective admitted patients, under this most restrictive scenario a), you may get a surprise. Like this:
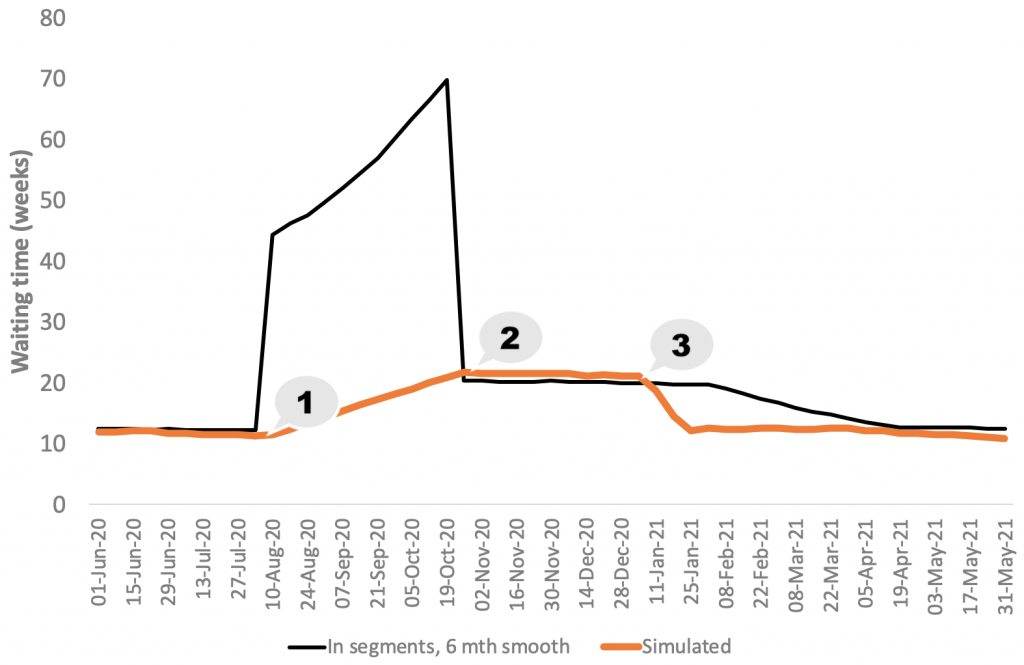
The abrupt jumps in waiting times between points 1 and 2 look absurd, and don’t match the simulator. What is going on?
We’ll look at this properly below, but perhaps you just quickly want to know what to do. My suggestion is this. During shutdown, assume that waiting times will rise by about one week, every week, and ignore the waiting times and long-waiters calculated by Gooroo Planner in your ‘shutdown’ model (everything else in that model should be alright, though). But your ‘recovery’ model should be fine, so do use the waiting time profiles that Gooroo Planner calculates for the recovery.
Understanding the results in detail
Now, let’s understand why the modelling works the way it does. We need to start by recalling what we did.
First we planned the shutdown. Then we rolled that plan forward into a new model, and planned the recovery.
Because these were both new models, neither of them ‘knew’ what had happened beforehand. So the shutdown model could see that outpatient activity was very low, and therefore very few patients would convert to the admitted elective waiting list; but it didn’t ‘know’ that – just before the shutdown – outpatient activity had been much higher.
Likewise, the recovery model could see that outpatient activity was high, and therefore lots of patients would convert onto the admitted elective waiting list; but it didn’t ‘know’ that – just before the recovery – outpatient activity had been minimal.
This matters, because it affects the way Gooroo Planner calculates waiting times. No matter how you calculate waiting times, the rate that patients are flowing through the service matters just as much as the size of the waiting list. For instance, imagine you are queueing at the Post Office. If there is one counter open, and it serves one customer per minute, and you are 5th in the queue, then you are going to wait about 5 minutes. If there are two counters open, and you are 10th in the queue, you will also wait about 5 minutes. Doubling the queue size is exactly balanced by doubling the throughput.
Look again at the chart above. The step labelled 2 is where the shutdown ends and the recovery starts.
In the shutdown model, patients were being added to the waiting list (and treated from it) very slowly indeed, but the waiting list was huge; therefore the calculated waiting time was huge too. But in the recovery model that followed, patients were being added to the waiting list (and treated from it) much faster; therefore the calculated waiting time is much smaller for the same size of waiting list.
Simulation
In real life (which the simulator does its best to mimic) waiting times cannot jump up suddenly like this – at most they can only grow by one week, every week. So what does the simulator show us?
At the point labelled 1 in the chart above, the simulator looked like this:
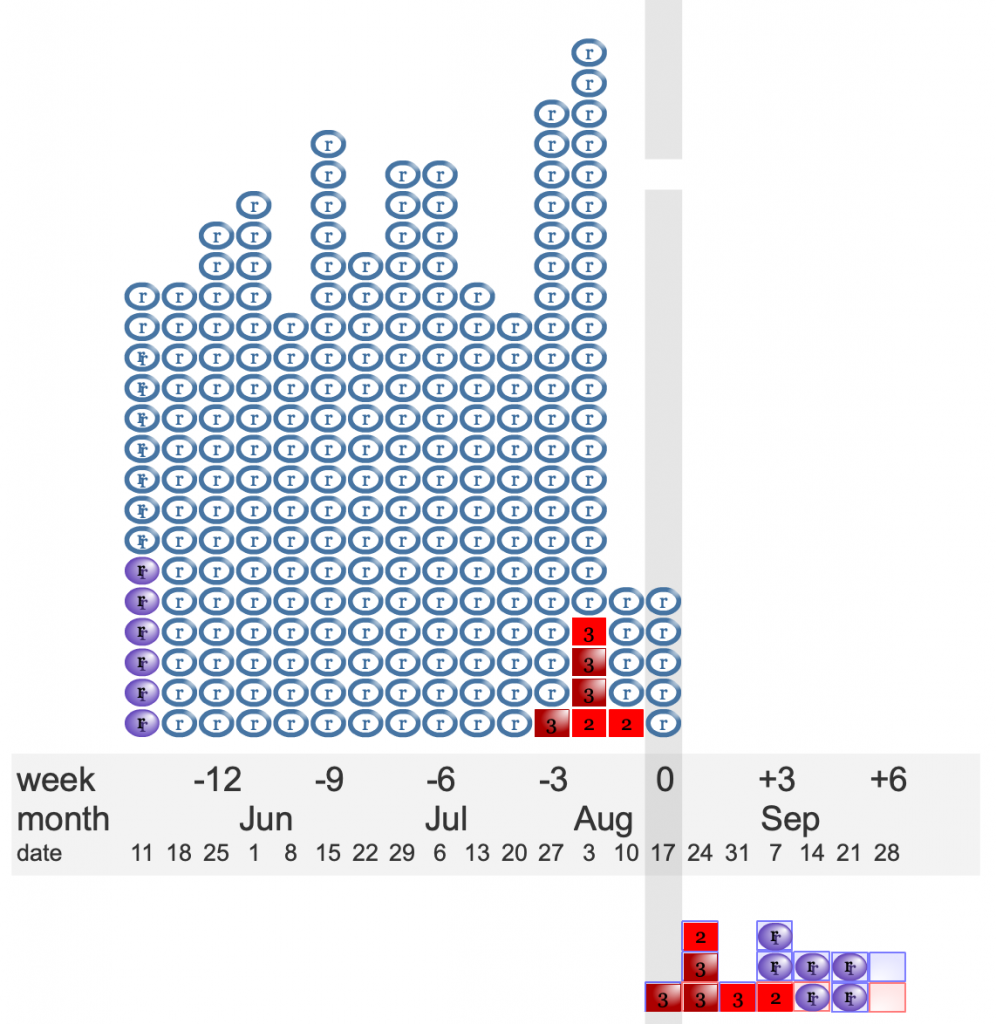
The waiting list is in the top left quadrant, and nearly all the patients on it were added before the shutdown. The shutdown started a couple of weeks ago, and meant that very few patients were being added to the list. The lower right quadrant shows the capacity that is available in future – very little. So during the shutdown, the available capacity is all going to be needed for urgent patients, and that massive waiting list will simply sit there growing old.
At the point labelled 2 in the chart above, the simulator looked like this:
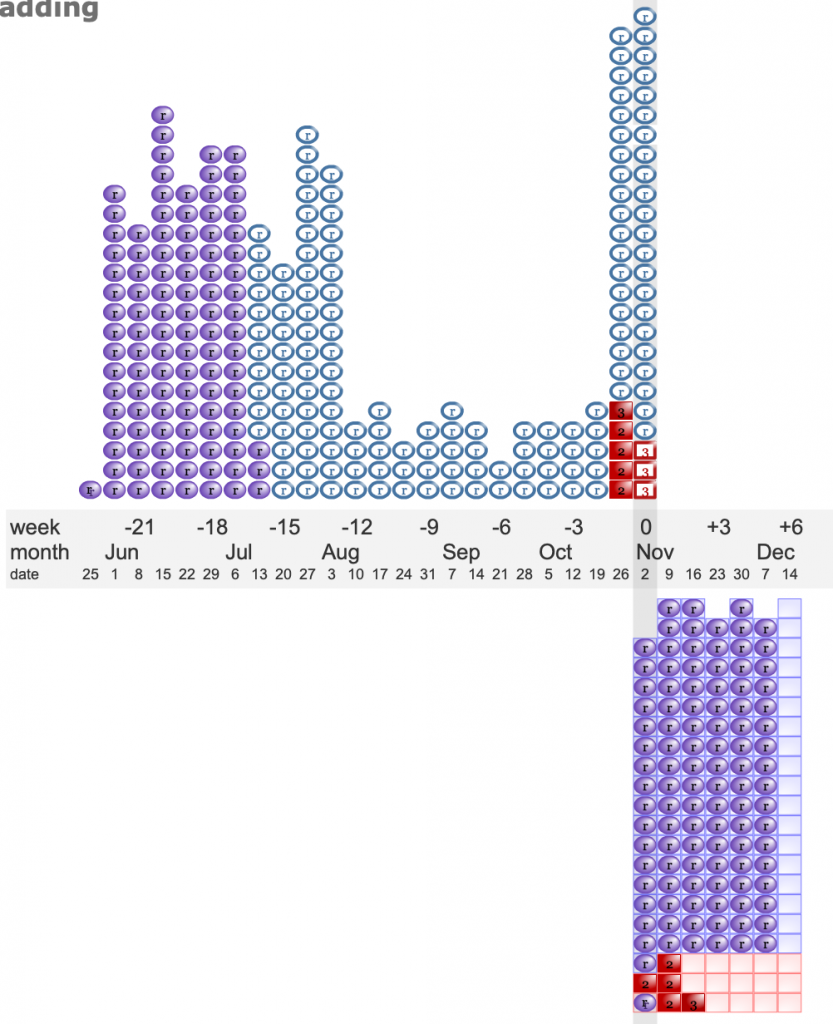
Looking at the waiting list in the top left quadrant, you can see that plenty of patients are now being added to the waiting list again. The lower right quadrant shows that capacity is high too. Waiting times are going to remain fairly steady while the new capacity works through that pre-shutdown backlog, and then there will be rapid progress on waiting times while it eats through the skinny ‘shutdown’ part of the waiting list (which is exactly what we see just after point 3 in the chart higher up).
Extreme measures during covid-19
So that’s why our calculated waiting times jumped up and down. Usually Gooroo Planner is able to cope with this kind of thing, either because the shutdown and recovery are both in the same model (e.g. during and after Christmas), or because neither are very dramatic (e.g. a normal waiting time recovery). But covid-19 is much more extreme, and the necessary multi-year recovery is far too long to plan in the same model as the shutdown.
If it were possible to model all this in a single model, the next chart shows what it would look like. It shows the admitted elective chart from earlier, overlaid (in dotted lines) with waiting times calculated by Gooroo Planner in a single planning model that covers both the shutdown and the recovery.
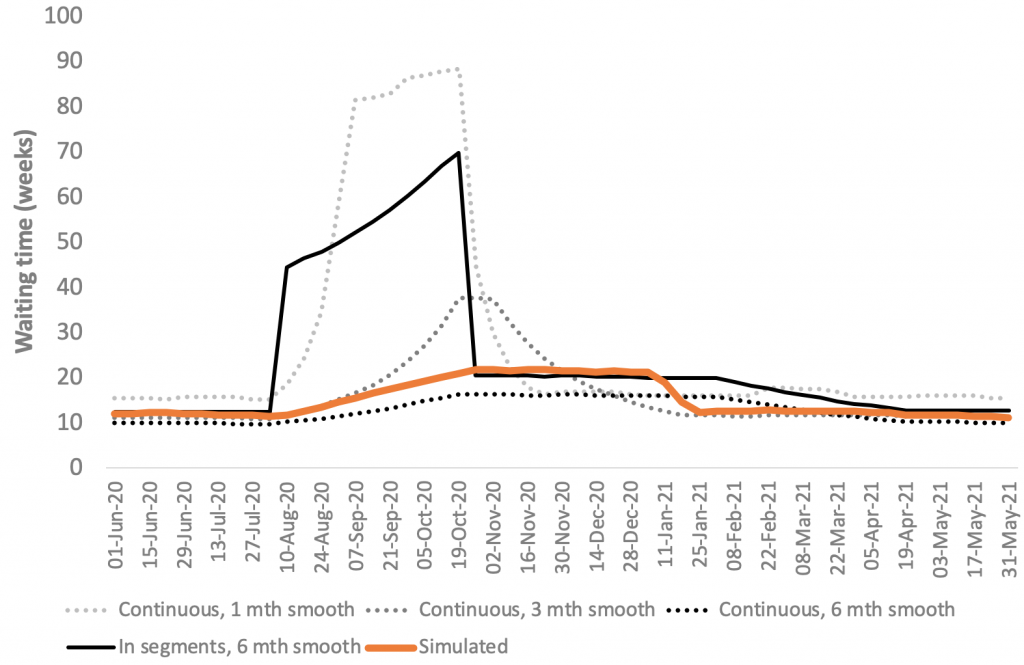
Ever wondered what that option “Calculate addition rate using additions from previous month(s)”, towards the end of the Calculation Settings, was all about? Now you are going to find out.
When Gooroo Planner calculates the rate that patients are being added to the waiting list, so that it can calculate waiting times, it takes an average over several previous months. This allows for the fact that changes take time to work their way through the waiting list.
The chart above shows, in the dotted lines, how Gooroo Planner handles a single-model shutdown and recovery when that averaging is done over the previous 6 months (the default), 3 months, and just 1 month. You can see that 6 months works pretty well in this scenario. Which is why it’s the default option in Gooroo Planner.
Support
Still need a bit of help? You have unlimited remote support inclusive with your Gooroo Planner licence. Email support@gooroo.co.uk
If you don’t have Gooroo Planner yet, but are interested, then ask for a free demo (we can do this remotely, especially during covid-19)
Return to Post Index
Leave a Reply
You must be logged in to post a comment.