Different beds, different bed occupancies
27/02/2019by Rob Findlay
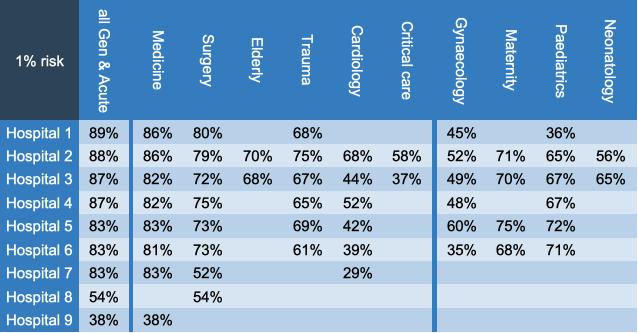
So far these articles have used a particular pool of adult general and acute beds as an example, but every bed pool is different. The following table applies the same methods to 59 different bed pools.

Even within the larger units in the general and acute bed category, these hospitals range from 83 per cent to 89 per cent bed occupancies to have the same risk of running out of beds. Why the variation? Mainly because different hospitals have different sizes of bed pool, and in general a larger bed pool can absorb variation more easily.
Smaller bed pools need lower bed occupancy
To see why, imagine that you are about to toss a number of coins. What are the odds that 70 per cent or more will be ‘heads’? The answer depends on the number of coins. If there are 10 coins, then the odds are better than 1 in 6. But if there are 100 coins, the odds are worse than 1 in 25,000.
Similarly in larger bed pools, a spike in demand in one area is more likely to be averaged out by a lull in another.
The differences in bed occupancy are even larger when we look at maternity, paediatrics and neonatology – even assuming a constant 1 per cent risk in all cases. But it is a bit artificial to hold the risk level steady. In real life the differences would be much larger, because general and acute beds could probably accept a higher risk of several per cent, whereas in the other bed pools the consequences for clinical safety would be greater and the risk would need to be much lower.
In Hospital 3, for instance, a 0.1 per cent risk of running out of beds would imply a bed occupancy of just 63.8 per cent in maternity, 60.2 per cent in paediatrics, and a cot occupancy of 58.2 per cent in neonatology. Those occupancies are far lower than the recommendations of official and professional bodies that we reviewed in the first article in this series, let alone the higher occupancies that are prevalent today.
Different patterns of variation
Looking into the detail behind these numbers, the pattern of variation is also different between these bed pools, and again this has been a theme across the hospitals we have looked at so far. The charts below show the week by week and intra-week variations in adult general and acute beds (top chart), and in paediatrics (bottom chart).

The first difference is in the week by week variation. The forecast, which is shown by the central grey line, uses an exponential smoothing model which is ‘tuned’ using the first half of the data. This tuning process works out whether the forecast needs to respond quickly to the most recent changes, or whether it is better to ride out the fluctuations and produce a smoother forecast.
In the top charts showing general and acute beds, the tuning process has concluded that riding out the fluctuations with a smooth forecast will produce the best results. In practical terms this means that if you want to forecast next week, then you should average many recent weeks for a reasonable estimate.
The bottom charts for paediatrics are completely different. Here, the tuning process has concluded that only the recent past matters, and a few weeks ago is already ancient history. So if you want to know what next week is going to look like, then it’s best to look at this week. The result is a much more variable forecast, pointing to the need for much greater flexibility in the way that paediatric bed capacity is used (or alternatively to even lower bed occupancy to maintain acceptable levels of risk).
The second difference is in the intra-week variation. The paediatric charts do not show the characteristic regular daily and weekly cycles of the general and acute beds, and instead random variation dominates. As a result, there is almost no difference in risk when morning and weekend average discharges are adjusted to match average admission rates.
This is just one example, but similar patterns were seen across most of the hospitals looked at here.
Every bed pool is different
The conclusion then is that every bed pool is different, and different clinical areas differ in their patterns of variation. Different types of bed pool need to operate at different levels of risk, because running out of beds has different consequences for clinical safety. Different sizes of bed pool need different bed occupancies. Not only that, but different bed pools show different patterns of variation, and the past is a different guide to the future.
In the first article we looked at the variety of bed occupancy levels being recommended by different official and professional bodies, and now we can see that none of them can be applied universally (though there may be themes). If they had instead recommended an acceptable risk of running out of beds, they would have been closer to the mark. Because, as NICE concluded, “optimum occupancy levels may vary”.
This concludes the analyses of non-elective bed occupancy. In the final article we will look at the consequences for elective beds, and how a risk-based approach can help with the long-running debate about separating ‘hot’ and ‘cold’ facilities.
I would like to thank the Emergency Care Intensive Support Team at NHS Improvement for their helpful suggestions during the preparation of these articles, Piotr Fryzlewicz, Professor of Statistics at the London School of Economics, for reviewing and advising on the statistical methods used, and those acute hospitals in England and Scotland who helped to pilot the methods.
We can calculate the relationship between bed occupancy and risk for your acute hospital – please get in touch if you are interested.
Return to Post Index
Leave a Reply
You must be logged in to post a comment.