waiting time statistics
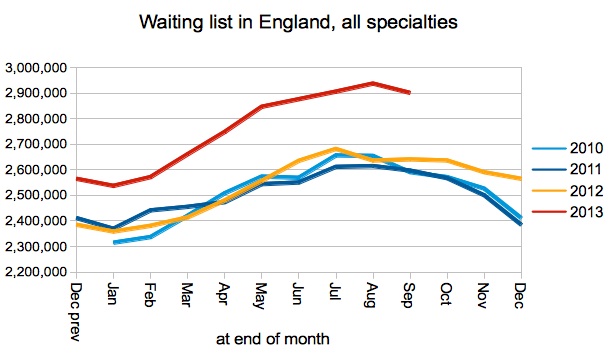
Waiting times lengthen rapidly as winter bites
The elective recovery ground to a halt in December, as waiting times showed their fastest increase since July.

The elective recovery ground to a halt in December, as waiting times showed their fastest increase since July.

Elective waiting times have risen from 22 weeks to 23 weeks over the last 14 months, and there is still no end in sight. The... Watch the video

English waiting times rose from 26.5 to 30.6 weeks in April, with over a million patients waiting longer than 18 weeks, and 11,000 waiting longer... Watch the video

Waiting times didn't get significantly worse in September, and some indicators improved. But it's still going to be tough to stop the waiting list from... Watch the video

Yet another large trust stopped reporting its referral-to-treatment data, which clouded the picture for the latest November figures and raised non-reported waiting lists to a... Watch the video
The position on English waiting times remained steady in September. But nearly half the country's one-year-waiters were reported at just one hospital.
The winter lull kept English waiting times below 20 weeks for the last few months, but now they're back. This time it's probably permanent.

Waiting times would have to grow a lot slower than they did over the summer, to avoid an England-wide breach of 52 weeks by the... Watch the video
Scotland's outpatient waiting list is building up quite a backlog. The longer it's left, the harder it will be to fix.

Waiting times are creeping up as waiting list management processes wither