Elective admissions fall again
Elective admissions fell to their lowest July rate in ten years. It wasn't a patch on winter's torrid slowdown though.
Filter blog posts
You can filter out our blog posts below by a category relevant to yourself.

Elective admissions fell to their lowest July rate in ten years. It wasn't a patch on winter's torrid slowdown though.

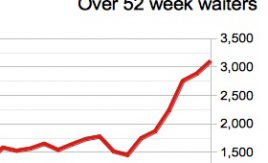
The rise in one year waiters has accelerated.

Managers are making huge efforts to admit ever more patients through limited beds. Our analysis suggests that most of those interventions will make little difference - though there is one that will.

One year waiters should be going down. Instead they are soaring.

Should your bed occupancy be 85 per cent, or 92 per cent? In fact, probably neither because it depends on the situation. We've developed a way of working it out, and were wondering if you'd like to give it a try?

The money's on its way, and the government wants to restore 18 week waits. Waiting list initiatives have a proven track record, don't they? And so did Aesop's hare.

The NHS has now failed to keep up with demand since RTT records began.

If you plan capacity without allowing for variation, disaster will follow. Or will it?

It's a surprisingly small challenge, so why not?

If you upload data to Gooroo Planner then you should really read this, because you may need to take action. (Updated on 25th May)