English RTT waits better than expected
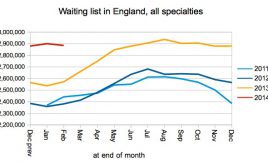
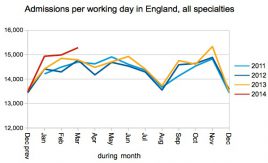
The English waiting list dodged the 3 million mark again, helped along by a surge in admissions and yet another Trust dropping out of the statistics. As expected, the admitted patient target was breached again, which is a sign of both stress and action. Plus a full detailed analysis of the local waiting times around England.