Your 18 week waits: September 2013 data
Interactive maps of local NHS waits around England, showing the pressures and one-year-waits, with links to all the detail by organisation and specialty.
Filter blog posts
You can filter out our blog posts below by a category relevant to yourself.
Interactive maps of local NHS waits around England, showing the pressures and one-year-waits, with links to all the detail by organisation and specialty.
Now you can integrate Gooroo Planner into your business intelligence system, using the new Planner API. So everyone can track outturn against bang-up-to-date, seasonally-adjusted, week-by-week plans, even if they've never heard of Gooroo.
The CQC and Monitor are applying the 18-weeks targets in ways that deter hospitals from treating long-waiting patients. If there is a good reason for this, I'd like to hear it.
You're already implementing your winter plan, right? To get inpatients lists down before the winter peak? Well, winter planning is really hard using a spreadsheet. So it's time to dump the spreadsheet.
The waiting list put on a surprising growth spurt in August, as the NHS failed again to keep up with the rise in referrals. Yet long-waits performance remained steady. Whether this will hold into winter remains to be seen.
Interactive maps of local NHS waits around England, showing the pressures and one-year-waits, with links to all the detail by organisation and specialty.
How can we structure this year's planning round, to stop it from going around in circles?
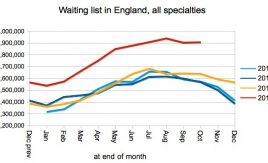
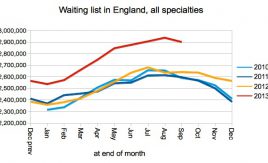
The English waiting list peaks just below 3 million: the largest reported list size since April 2008. But 18 weeks performance remains steady.
All the local detail on 18 weeks by provider, commissioner and specialty, with interactive maps
Latest developments: training videos, SimActive file splitter utility for Excel 2003, converting Planner reports into datasets, and a new waiting times calculation.