Waiting list tops 4 million as admission rates slump
The waiting list has been threatening to exceed 4 million patients for a while now, and in June it finally popped over. A slump in the admission rate didn't help.
Filter blog posts
You can filter out our blog posts below by a category relevant to yourself.

The waiting list has been threatening to exceed 4 million patients for a while now, and in June it finally popped over. A slump in the admission rate didn't help.

In theory, the NHS has highly sophisticated processes for finance and activity planning. In practice they are rather less polished. So here are two changes that would transform planning for the better.

What is control charting? How does it differ from a straightforward chart of performance over time? Why does it make such a huge difference to management? And why does it matter now?

Elective waiting times improved seasonally during May, but the longer term trend remains for ever increasing waits.

Everybody agrees that clinical priorities should come first. Why does this principle break down when it comes to follow-up outpatients?
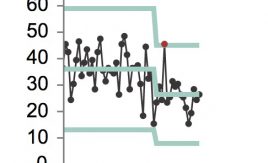
Is your bed flow designed to deliver regular crises? Is theatre performance stable? Control charts analyse your bed, theatre and clinic capacity for different days of the week, so that you can tell what was expected performance and what was unusual.
The winter lull kept English waiting times below 20 weeks for the last few months, but now they're back. This time it's probably permanent.

Elective waiting times are still shooting up in Scotland. And I reckon they're a good deal longer than in England.

The 14-day and 31-day cancer targets suggest that cancer waits can be managed like other elective waiting lists. But the complexity of cancer pathways suggests that a different approach is needed.

Our old server was over 3 years old, so we decided it was time to replace it. And the new one is a lot beefier.