Interpreting Capacity analysis: the Charts
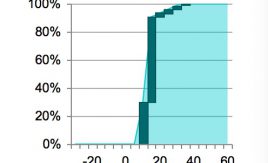
The Charts view gives you a statistical analysis of theatre and clinic usage on different days of the week. This is how it works, and how you interpret it.
Filter blog posts
You can filter out our blog posts below by a category relevant to yourself.
The Charts view gives you a statistical analysis of theatre and clinic usage on different days of the week. This is how it works, and how you interpret it.

In September 2016 we are going to replace Gooroo Planner's unsupported free read-only licences with supported Standard licences. The price? Just £1,000+VAT per user per year.

Tailgating strategies powered the global financial crisis. Now the NHS is doing it too.

It sounds sensible to book patients in before they breach the target. But in practice it is unfair, unsafe, and keeps waiting times on the brink of failure. There is a better way.
In principle, we can plan the hospital to smooth out expensive peaks and troughs in capacity. In practice we need to apply some common sense too.

Keeping waiting times close to the brink is a false economy. Make headroom once, and you can run the hospital more cheaply forever.

Clinical pathways don't always run in straight lines. Here is how you can model even quite complex pathways quickly and easily using Gooroo Planner.

The "exceptions table" sounds innocuous enough. But whoever controls it has the power to transform the management of entire hospitals.

After the initial 'one-day' implementation of Gooroo Planner, one of the first refinements you will want to make is around the diagnostic stage of treatment. Fortunately, it's easier than you might think.

Operational managers often like to see their capacity plans at sub specialty level, especially in general surgery and orthopaedics. This is easily done in Gooroo Planner, but here are some things you may need to watch out for. And it's similar for other levels of detail, such as hospital site, commissioner, and procedure based modelling.